EUR/USD 1H
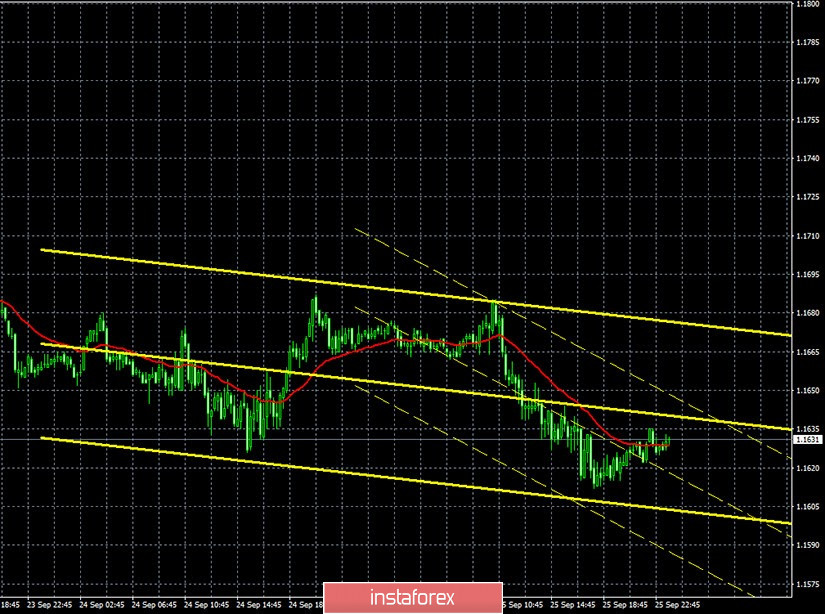
The EUR/USD pair moved down after a low correction on the hourly timeframe on September 25, within which it could not even reach the critical line, which was very close. Therefore, the downward trend continues for the pair, as evidenced by the descending channel. The price even tried to go below this channel on Friday, but it didn't work out. Thus, after such a long break, bears are now in control of the pair's direction. The long-awaited downward pullback began, which we had been waiting for at least a month. Now the only question is how much the US dollar will be able to rise in price, for which the fundamental background has not changed much in recent weeks.
EUR/USD 15M

Both linear regression channels are still pointing to the downside on the 15 minute timeframe, indicating that the downward movement may continue. The euro/dollar fell by about one and a half cents last reporting week (September 16-22). Recall that the previous Commitment of Traders (COT) report showed that the "non-commercial" group of traders, which we have repeatedly called the most important, sharply reduced their net positions. Thus, in general, the downward movement that began later on was sufficiently substantiated. The only problem is that it started late. The new COT report, which only covers the dates when the euro began its long-awaited fall, showed completely opposite data. Non-commercial traders opened 15,500 new Buy-contracts (longs) and almost 6,000 Sell-contracts (shorts) during the reporting week. Thus, the net position for this group of traders has increased by around 9,000, which shows that traders are becoming bullish. Accordingly, the behavior of the EUR/USD pair and the COT report data simply do not match. For the second week in a row. However, if you try to look at the overall picture, you can still note a very weak strengthening of the bearish sentiment, so the COT report allows a slight fall in the euro. The question is, how little movement can you expect? The pair went down 270 points from the last local high.
There was only one important report on Friday, September 25. Durable goods orders in the United States. The main indicator increased by only 0.4% in August, the indicator excluding defense and aviation - by 1.8%. Indicator excluding transport - by 0.4%. Indicator excluding defense - by 0.7%. In general, approximately the same figures were predicted. Therefore, traders did not particularly react to this report. The dollar began to grow much earlier than when this report was released. Meanwhile, more and more economists believe that the potential for recovery in the US economy is nearing its peak. In other words, without additional stimulus and with current levels of coronavirus disease, the US economy will find it difficult to continue to show "higher growth rates than expected," said Federal Reserve Chairman Jerome Powell. And the Democrats and Republicans still have not agreed on the size of the new package of financing the economy. And the number of daily recorded cases of the disease is stable at 40-45,000 per day. No important macroeconomic and fundamental events in the EU and the US are scheduled for Monday.
We have two trading ideas for September 28:
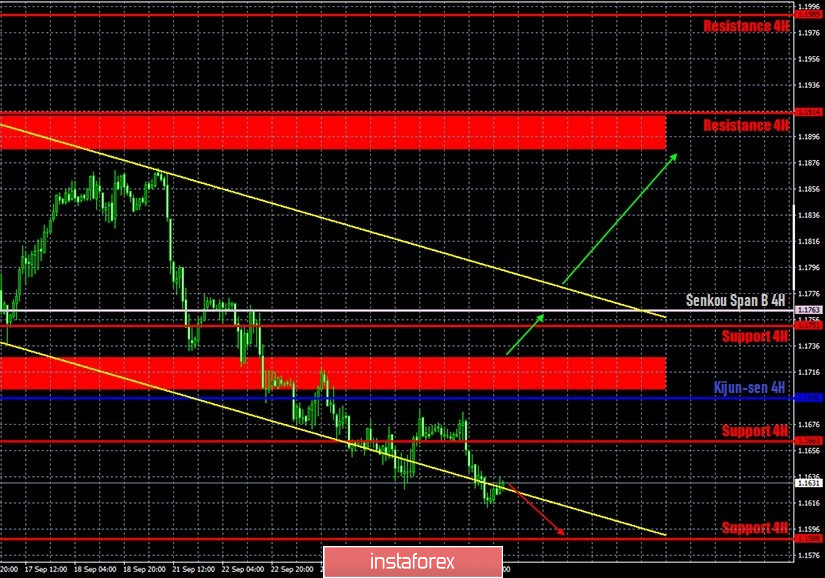
1) Buyers remain outside of the market, but they can be active at any time, as evidenced by the data of the COT report. Therefore, we recommend considering long positions if the pair settles above the Kijun-sen line (1.1696) and the resistance area of 1.1704-1.1728, while aiming for the Senkou Span B line (1.1763) and the resistance area of 1.1894-1.1910. Take Profit in this case will be from 20 to 150 points. Of course, ideally, you should wait for the quotes to settle above the descending channel.
2) Bears have been showing more and more desire to put pressure on the pair lately. Nevertheless, the same COT report warns that the dollar's rise may be very short-lived. Nevertheless, while the price is below the Kijun-sen line, you are recommended to continue trading down while aiming for 1.1588 (new target levels will be formed today). In this case, the potential Take Profit is up to 40 points.
Explanations for illustrations:
Support and Resistance Levels are the levels that serve as targets when buying or selling the pair. You can place Take Profit near these levels.
Kijun-sen and Senkou Span B lines are lines of the Ichimoku indicator transferred to the hourly timeframe from the 4-hour one.
Support and resistance areas are areas from which the price has repeatedly rebounded off.
Yellow lines are trend lines, trend channels and any other technical patterns.