To open long positions on GBPUSD, you need:
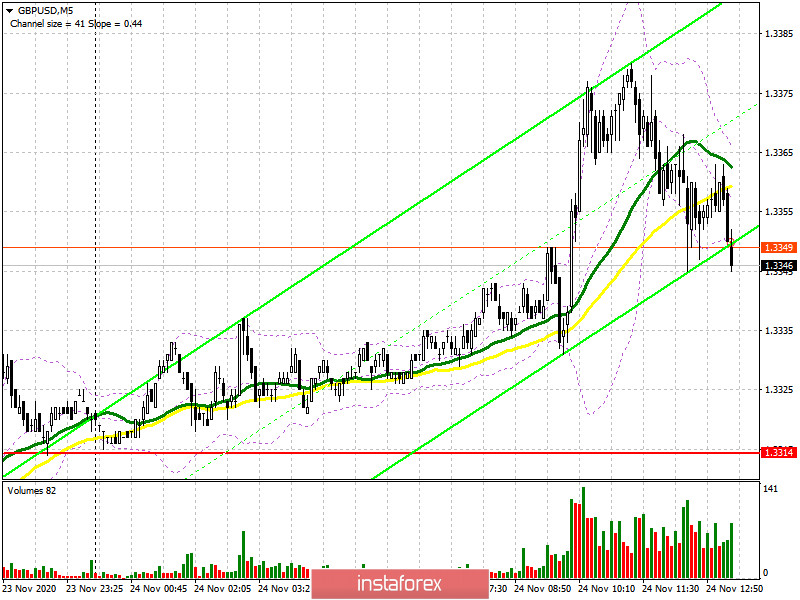
In the first half of the day, no signals were formed to enter the market, since we did not reach any of the levels I indicated. The calculation for the fall of the pound when the support broke 1.3314 was also not justified, as the bulls did not let GBP/USD even close to this range. So I reviewed the nearest support and resistance levels so that we can build on something in the afternoon. Let's figure out how to proceed.

For buyers, the entire focus will be shifted to the report on the index of consumer sentiment of Americans. Bad data will lead to a breakout of the resistance of 1.3376, a test of which from the top down will form an excellent signal to buy the pound in the expectation of continuing the upward trend formed earlier this week. In this scenario, the nearest target of the bulls will be the resistance of 1.3453, where I recommend taking the profit. A more serious task will be to update the area of 1.3523, where you can also watch the bull market stop. If the report turns out to be better than economists' forecasts, then the bulls can only hope for the formation of a false breakout in the support area of 1.3325. If there is no activity there and this area is broken, I recommend that you postpone long positions to a larger minimum of 1.3267 yesterday, from where you can buy the pound immediately for a rebound in the expectation of a correction of 20-30 points within the day.
To open short positions on GBPUSD, you need:
Bears are still fighting to maintain control over the 1.3378 level. The next formation of a false breakout there after the US data will lead to the formation of a signal to open short positions in the expectation of a return to the morning support of 1.3325, on which a lot now depends. A break of 1.3325 with consolidation below will return new large sellers to the market, which will quickly push GBP/USD to the area of the minimum of 1.3267, where I recommend fixing the profits. It will be possible to talk about the resumption of the bear market only after the breakdown of 1.3267, which will lead to the demolition of several stop orders from buyers and a rapid movement of the pair down to the area of 1.3194. If in the second half of the day, when the pair approaches the level of 1.3376, the bears do not show activity, it is best to abandon short positions until the new maximum is updated in the area of 1.3453, where you can sell the pound immediately for a rebound in the expectation of a correction of 20-30 points within the day.
Let me remind you that in the COT reports (Commitment of Traders) for November 17, there was a reduction in long positions and a sharp influx of short positions. Long non-commercial positions declined from 27,872 to 27,454. At the same time, short non-commercial positions increased from 45,567 to 47,200. As a result, the negative non-commercial net position was -19,746 against -17,695 a week earlier, which indicates that the sellers of the British pound retain control and their preponderance in the current situation. The lack of clarity on the trade agreement, together with the lockdown of the British economy in November this year, clearly does not add optimism and confidence to buyers of the pound.
Signals of indicators:
Moving averages
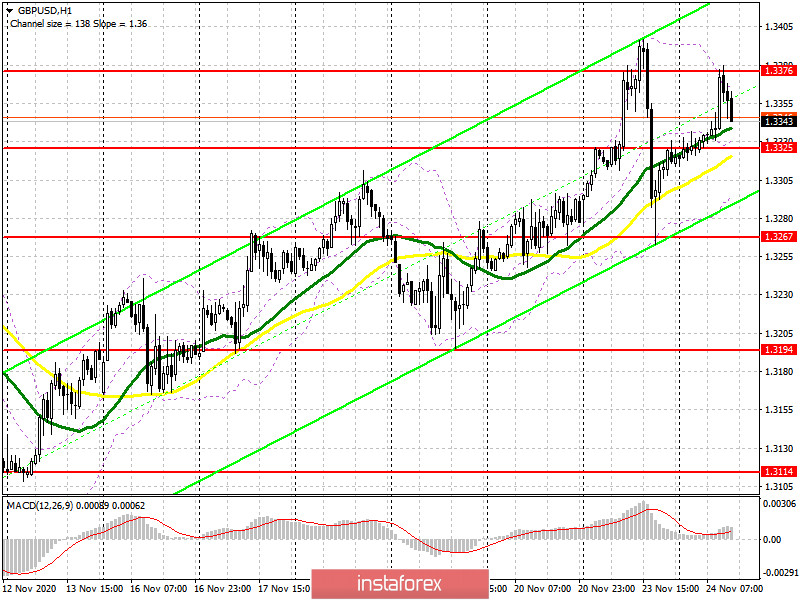
Trading is above 30 and 50 daily averages, which indicates an active attempt by buyers of the pound to continue growing.
Note: The period and prices of moving averages are considered by the author on the hourly chart H1 and differ from the general definition of classic daily moving averages on the daily chart D1.
Bollinger Bands
Breaking the upper limit of the indicator around 1.3376 will lead to a new wave of growth of the pound. A break of the lower limit in the area of 1.3285 will increase the pressure on the pair.
Description of indicators
- Moving average (moving average determines the current trend by smoothing out volatility and noise). Period 50. The graph is marked in yellow.
- Moving average (moving average determines the current trend by smoothing out volatility and noise). Period 30. The graph is marked in green.
- MACD indicator (Moving Average Convergence / Divergence - moving average convergence / divergence) Fast EMA period 12. Slow EMA period 26. SMA period 9
- Bollinger Bands (Bollinger Bands). Period 20
- Non-profit speculative traders, such as individual traders, hedge funds, and large institutions that use the futures market for speculative purposes and meet certain requirements.
- Long non-commercial positions represent the total long open position of non-commercial traders.
- Short non-commercial positions represent the total short open position of non-commercial traders.
- Total non-commercial net position is the difference between the short and long positions of non-commercial traders.