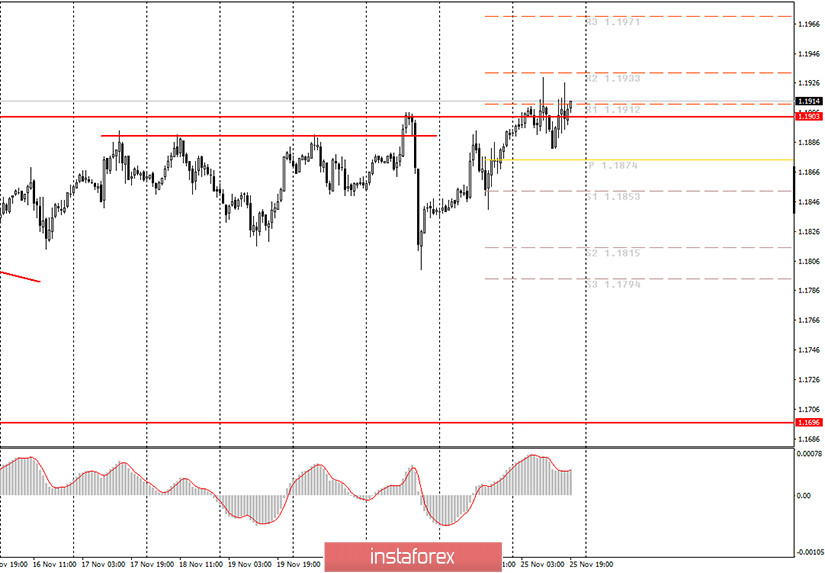
EUR/USD hourly chart

On Wednesday, the EUR/USD currency pair tested the upper boundary of the sideways channel twice and crossed it at 1.1903. In the morning review, we did not recommend opening long positions even if the price breaks above this level. We advised novice traders to wait until the MACD indicator reached a zero level. As you can see, our recommendation was right. The pair did not continue its upward movement during the day. We also advised you to refrain from opening short positions today. In the morning we mentioned that if the pair hits a new high near the level of 1.1910, this will complicate the current technical picture. So, selling the euro was not a good idea. As a result, the best option today was not to enter the market at all. At the moment, the situation is rather confusing, especially for beginners. For the first time in four months, the price did not just pull back from the 1.1903 level or break through it. It was actually holding right at this level for the entire session. Therefore, it is impossible to say for sure whether the price has broken through this level or rebounded from it. Most likely, it did neither of the above. This means that we do not have a clear signal indicating the end or the continuation of the uptrend. To be more precise, we have no evidence of an upward trend. Currently, we do not observe any trendline or trend channel. So, now there is a 50% chance that the price will move either up or down.
On Wednesday, two important macroeconomic reports were released in the US. This morning and the previous night we warned that these reports would not have any significant effect on the pair. So, our forecast was confirmed. The thing is that the GDP data did not surprise the markets. It is usually published several times during each quarter. Today, the third estimate has been published and it did not differ much from the previous one. So, in the third quarter, US GDP accelerated to +33.1% q/q. Obviously, traders expected to see such figures. The same is true for the report on durable goods orders. This category of goods is distinguished by its high cost. Therefore, it is essential for the GDP estimates. However, the four indicators showed moderate growth, although it was a bit higher than expected. Still, this was not enough to boost the demand for the US currency. Other reports were of little importance as well.
On Thursday, markets do not expect any important economic releases in the EU and the US. Moreover, traders seem to largely downplay the fundamental background. No burning topics are left on the agenda, and it seems that market participants do not really need them. We believe that tomorrow buyers will persist in pushing the price above the 1.1903 level. It is possible that the price will continue to move within 30-50 pips upwards with subsequent pullbacks to the downside.
Possible scenarios for November 26
1) Long positions are not relevant at the moment. Bulls are still trying to push the pair above the 1.1903 level. But these attempts are not enough to open the path to the new highs. Anyway, the MACD indicator is now holding at its highest levels, which does not imply opening long positions.
2) Selling the pair remains a better option. However, the price went slightly above the level of 1.1903. Since there is no trendline or other indication of an uptrend, it is difficult to say when this trend will be completed. Besides, you should refrain from opening short positions on the MACD sell signal as it can start the downward movement at any moment while the price has not declined yet. Therefore, it is better to stay in the wait-and-see mode.
On the chart
Support and Resistance Levels are the Levels that serve as targets when buying or selling the pair. You can place Take Profit near these levels.
Red lines are the channels or trendlines that display the current trend and show in which direction it is better to trade now.
Up/down arrows show where you should sell or buy after reaching or breaking through particular levels.
The MACD indicator (14, 22, and 3) consists of a histogram and a signal line. When they cross, this is a signal to enter the market. It is recommended to use this indicator in combination with trend patterns (channels and trendlines).
Important announcements and economic reports that you can always find on the economic calendar can seriously influence the trajectory of a currency pair. Therefore, at the time of their release, we recommend trading as carefully as possible or exit the market in order to avoid sharp price fluctuations.
Beginners on Forex should remember that not every single trade has to be profitable. The development of a clear strategy and money management are the key to success in trading over a long period of time.