To open long positions on EURUSD, it is required:
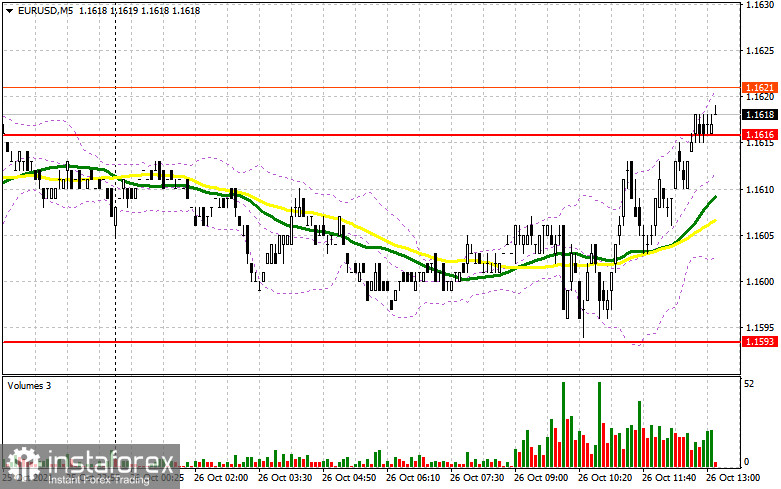
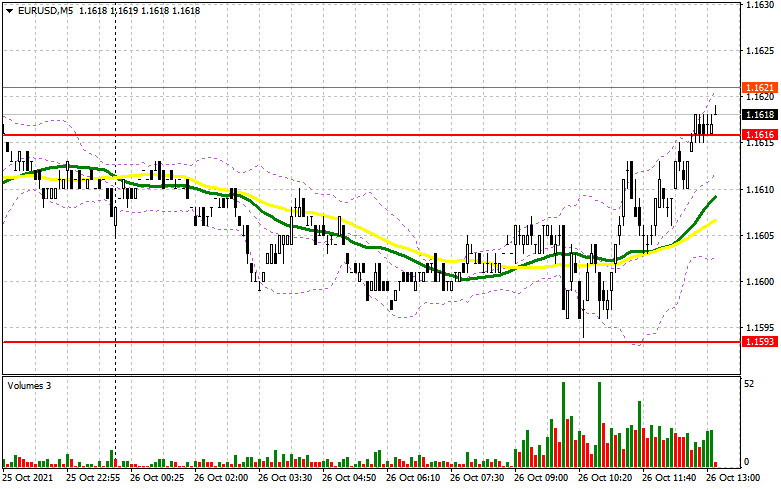
In the first half of the day, no signals were formed to enter the market. Let's take a look at the 5-minute chart with you and figure out what happened. Updates to the 1.1616 level, which I paid attention to in my forecast, occurred without volume and significant changes in the balance of power. It suggests that no people in the market are willing to sell euros after yesterday's fall, even at current prices. There was also no normal entry point into long positions after the 1.1616 breakout. All this forced us to revise the technical picture.
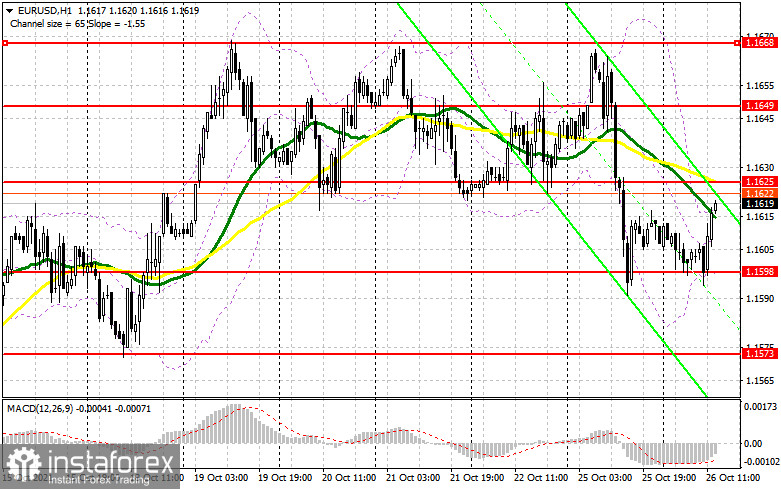
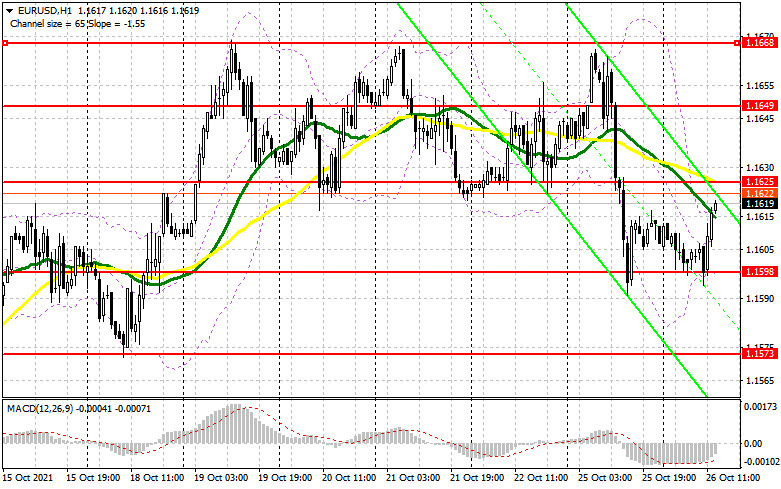
Given that the European session passed without any ups and downs amid the absence of important statistics on the eurozone, in the afternoon, the markets should shake the data on the indicator of consumer confidence in the United States and the volume of home sales in the primary market. I have reviewed the nearest resistance and support. The focus of the bulls will be on the same return of control, but already above the level of 1.1625, where the moving averages are, which will limit the upward potential of the pair. A breakout and consolidation above with a reverse test from top to bottom form an excellent signal to buy the euro will allow us to see a recovery to the resistance of 1.1649. A more distant target will be the upper border of the channel - 1.1668. Only a breakthrough in this area will indicate the continuation of the bullish scenario in the pair observed since the middle of this month. The 1.1668 test from top to bottom will open a direct road to the area of the 17th figure, where I recommend fixing the profits. The further target remains the 1.1716 area. In the case of a decline in the euro in the afternoon after strong statistics on consumer confidence in the United States, it is best not to rush with long positions. Only protection and the formation of a false breakdown in the area of 1.1598 will lead to a signal to buy the euro. In the absence of bulls at the level of 1.1598, the optimal scenario will be long positions immediately to rebound from 1.1574, or even lower - around 1.1542 with the aim of an upward correction of 15-20 points within the day.
To open short positions on EURUSD, you need:
Buyers are still reluctant to return to the market even after the upward correction observed in the first half of the day. Only the formation of a false breakdown there in the area of a new resistance of 1.1625 forms the first signal to open short positions, which will give an excellent point to the market to reduce to the support of 1.1598, to get beyond which it has not yet been possible. A breakout and a test of this area from the bottom up will increase the pressure on the pair and open the way to the lows: 1.1573 and 1.1542. I recommend fixing profits on short positions there. Under the scenario of euro growth during the US session after the expected weak data on the consumer confidence indicator in the US and the lack of bear activity in the 1.1625 area, I advise you to postpone sales until the next resistance test of 1.1649. But even there, it is best to open short positions after the formation of a false breakdown. The best option for selling EUR/USD immediately on a rebound will be the maximum of last week in the area of 1.1668. You can count on a downward correction of 15-20 points.
The COT report (Commitment of Traders) for 19 recorded a reduction in short and long positions, which led to a slight recovery of the negative delta, as more sellers left the market than buyers. Last week, inflation in the eurozone came out, which increased and coincided with economists' expectations. It forced many representatives of the European Central Bank to talk again about changes in monetary policy. However, the fact that almost everyone adhered to a wait-and-see attitude and continued stimulus measures in the form of bond purchases after completing the PEPP program in March next year put some pressure on the European currency. The slowdown in activity in the manufacturing and services sectors of the eurozone also did not allow euro buyers to get beyond the 17th figure. However, the key problem in the shorter term, which harms the growth of the euro, is the sharp spread of the fourth wave of coronavirus infection throughout the European Union. As for the United States of America, the good pace of recovery of the American economy continues to support the US dollar. The fact that the Federal Reserve is already seriously considering curtailing the bond purchase program at the next meeting in November will also limit the upward potential of the euro against the US dollar. The COT report indicates that long non-commercial positions decreased from 202,512 to the level of 193,320, while short non-commercial positions dropped from the level of 220,910 to the level of 205,427. At the end of the week, the total non-commercial net position decreased and amounted to -12,107 against -18,398. The weekly closing price rose to the level of 1.1613 against 1.1553.
Signals of indicators:
Moving averages
Trading is conducted below 30 and 50 daily moving averages, which indicates a slight advantage of the euro sellers.
Note: The author considers the period and prices of moving averages on the hourly chart H1 and differ from the general definition of the classic daily moving averages on the daily chart D1.
Bollinger Bands
A breakthrough of the upper limit of the indicator in the area of 1.1615 will lead to a new wave of euro growth. In case of a decline, the lower limit of the indicator in the area of 1.1598 will act as support.
Description of indicators
- Moving average (moving average determines the current trend by smoothing out volatility and noise). Period 50. The graph is marked in yellow.
- Moving average (moving average determines the current trend by smoothing out volatility and noise). Period 30. The graph is marked in green.
- MACD indicator (Moving Average Convergence / Divergence - moving average convergence/divergence) Fast EMA period 12. Slow EMA period 26. SMA period 9
- Bollinger Bands (Bollinger Bands). Period 20
- Non-profit speculative traders, such as individual traders, hedge funds, and large institutions that use the futures market for speculative purposes and meet certain requirements.
- Long non-commercial positions represent the total long open position of non-commercial traders.
- Short non-commercial positions represent the total short open position of non-commercial traders.
- Total non-commercial net position is the difference between the short and long positions of non-commercial traders.