To open long positions on EURUSD, you need:
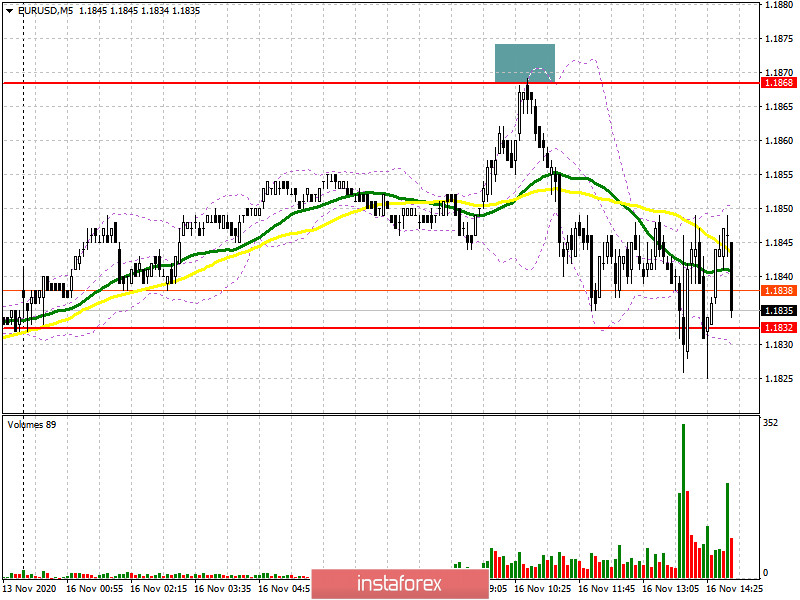
In my morning forecast, I paid attention to the sale of the European currency in the resistance area of 1.1868, provided that a false breakout was formed there, which happened. Let's look at a 5-minute chart of when it was possible and necessary to sell euros. An unsuccessful attempt to consolidate above 1.1868 and a lack of buyer activity - all this led to the return of the EUR/USD pair to this level and to the formation of a good entry point into short positions, which quickly pushed the pair into the area of morning support at 1.1832. It is at this level that all attention will continue to be focused.

By and large, nothing has changed from a technical point of view. Only the formation of a false breakout in the support area of 1.1832, which euro buyers are trying to do now, forms the entry point to long positions. In this case, the goal of restoring the pair will be a repeated test of the resistance of 1.1868, above which it was not possible to get out today. The longer-term goal will be the monthly maximum of 1.1915, where I recommend fixing the profits. Especially important fundamental statistics are not planned for today, so if the bulls do not show activity in the area of 1.1832, and while the bears are clearly aimed at breaking this range, we can observe a further downward correction of EUR/USD. In this case, in the second half of the day, buyers will focus on protecting the support of 1.1797. However, it is only possible to open long positions on the first test based on a correction of 15-20 points within the day. A larger reversal in favor of buyers will occur if they manage to form a false breakout at 1.1743.
To open short positions on EURUSD, you need to:
Sellers coped with one of the tasks and did not let the euro above the resistance of 1.1868, achieving a false breakout there. In the second half of the day, the focus is shifted to the support level of 1.1832, where the further direction of the pair will be determined. Only a consolidation below 1.1832 and its test from the reverse side from the bottom up form a more convenient entry point for short positions in the expectation of a resumption of the downward trend. In this case, the bears' nearest target will be at least 1.1797, but its test will only be an indication that the pair is stuck in a side channel. Only a breakdown and consolidation below this range will lead EUR/USD to the lower border of the side channel 1.1743, where I recommend taking the profit. It will be possible to talk about a real resumption of the bearish trend only after the test of the minimum of 1.1701. If the bulls are stronger in the second half of the day and again return the pair to the resistance of 1.1868, then you should not rush to sell. Only the formation of a false breakout there, similar to the morning sale, will be a signal to open short positions. Otherwise, I recommend considering selling EUR/USD immediately for a rebound only from the monthly maximum of 1.1915, based on a correction of 15-20 points within the day.
Signals of indicators:
Moving averages
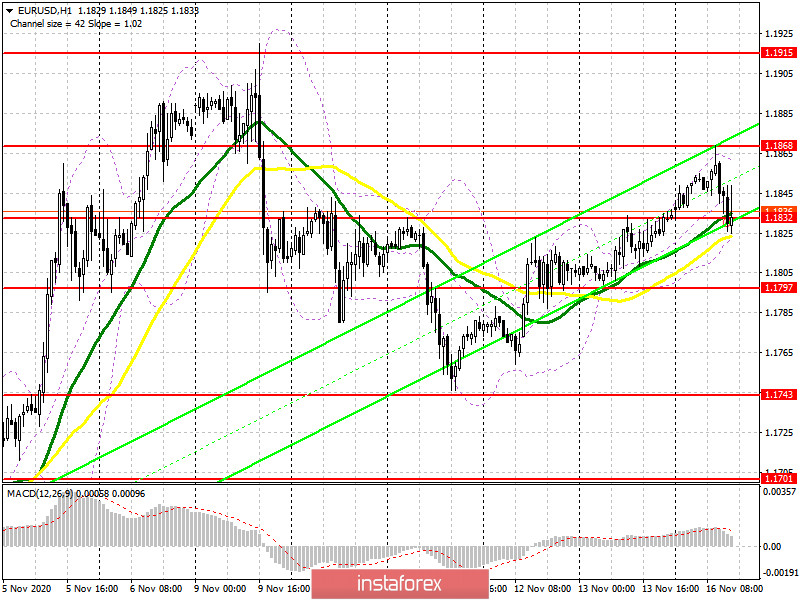
Trading is conducted around 30 and 50 daily moving averages, which indicates the sideways nature of the market.
Note: The period and prices of moving averages are considered by the author on the hourly chart H1 and differ from the general definition of the classic daily moving averages on the daily chart D1.
Bollinger Bands
If the pair declines, the lower limit of the indicator will act as support in the area of 1.1830, the breakout of which will increase the pressure on the pair.
Description of indicators
- Moving average (moving average determines the current trend by smoothing out volatility and noise). Period 50. The graph is marked in yellow.
- Moving average (moving average determines the current trend by smoothing out volatility and noise). Period 30. The graph is marked in green.
- MACD indicator (Moving Average Convergence / Divergence - moving average convergence / divergence) Fast EMA period 12. Slow EMA period 26. SMA period 9
- Bollinger Bands (Bollinger Bands). Period 20
- Non-profit speculative traders, such as individual traders, hedge funds, and large institutions that use the futures market for speculative purposes and meet certain requirements.
- Long non-commercial positions represent the total long open position of non-commercial traders.
- Short non-commercial positions represent the total short open position of non-commercial traders.
- Total non-commercial net position is the difference between the short and long positions of non-commercial traders.