empty
 
 
05.07.2022 11:21 PM
Technical analysis of EUR/USD for July 05, 2022

This image is no longer relevant

Overview :

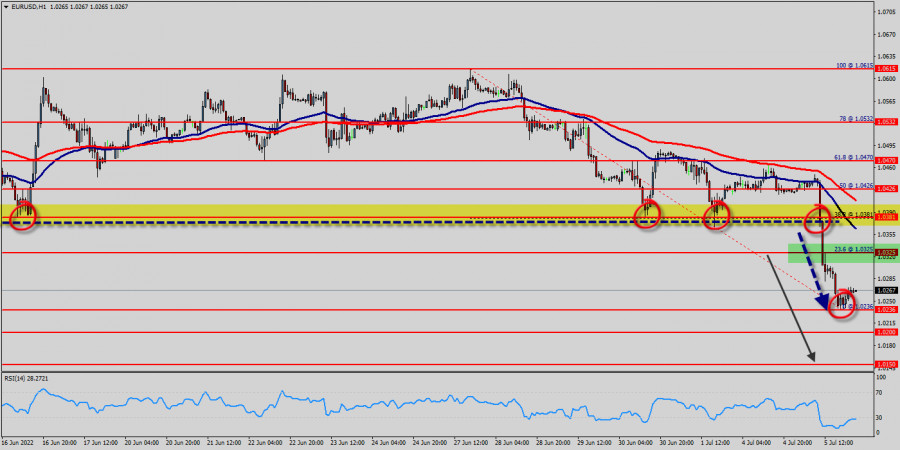
The EUR/USD pair traded in one direction in the range of 1.0426 to 1.0236 and closed the day out some significant changes that's lies in downtrend. The market was also trading in a downtrend range of 1.0325 - 1.0200, staying close to yesterday's closing price.

On the hourly chart, EUR/USD is still trading below the moving average MA (2100) H1 (1.0325). The situation is similar on the four-hour chart. Based on the foregoing, it is probably worth sticking to the south direction in trading, and while the EUR/USD pair remains below MA 100 H1, it may be necessary to look for entry points to sell for the formation of a correction.

The EUR/USD pair's down trend finally resumes and intraday bias is back on the downside. Next target is 1.0236 long term projection level. On the upside, above 1.0325 minor resistance will delay the bearish case and turn intraday bias neutral again.

Market analysis > Fundamental analysis : The euro depreciated below 1.0426 (support became a resistance), its lowest level since 20 years as weak economic data and rising gas prices strengthened the prospect of a widening monetary policy gap between the ECB and the US Federal Reserve. An energy crisis in Europe has clouded even further the outlook for growth in the Eurozone, making the ECB's task of taming record levels of inflation more difficult.

Market analysis > Sentiment analysis : psychological level set at the price of 1.0426 which represents a major resistance today. Probably, the main scenario is the continued decline from the level of 1.0426 to 1.0200. Alternative scenario is consolidation above MA 100 H1, followed by a rise to1.0470 (last high).

Market analysis > Technical analysis : The EUR/USD pair dropped from the level of 1.0426 to the bottom around 1.0236. But the pair has rebounded from the bottom of 1.0236 to close at 1.0267.

Today, the first support level is seen at 1.0200, and the price is moving in a bearish channel now. Furthermore, the price has been set below the strong resistance at the level of 1.0381, which coincides with the 38.2% Fibonacci retracement level.

This resistance has been rejected several times confirming the downtrend. Additionally, the RSI starts signaling a downward trend. As a result, if the EUR/USD pair is able to break out the first support at 1.0200, the market will decline further to 1.0150 in order to test the weekly support 2.

The EUR/USD pair will probably go down because the downtrend is still strong. Consequently, the market is likely to show signs of a bearish trend.

So, it will be good to sell below the level of 1.0381 with the first target at 1.0200 and further to 1.0150. At the same time, the breakup of 1.0325 will allow the pair to go further up to the levels of 1.0381 in order to retest the weekly pivot point again.

انسٹافاریکس کے ساتھ کرپٹو کرنسی کی معاملاتی تبدیلیوں سے کمائیں۔
میٹا ٹریڈر 4 ڈاؤن لوڈ کریں اور اپنی پہلی ٹریڈ کھولیں۔
  • Grand Choice
    Contest by
    InstaForex
    InstaForex always strives to help you
    fulfill your biggest dreams.
    مقابلہ میں شامل ہوں
  • چانسی ڈیپازٹ
    اپنے اکاؤنٹ میں 3000 ڈالر جمع کروائیں اور حاصل کریں$1000 مزید!
    ہم اپریل قرعہ اندازی کرتے ہیں $1000چانسی ڈیپازٹ نامی مقابلہ کے تحت
    اپنے اکاؤنٹ میں 3000 ڈالر جمع کروانے پر موقع حاصل کریں - اس شرط پر پورا اُترتے ہوئے اس مقابلہ میں شرکت کریں
    مقابلہ میں شامل ہوں
  • ٹریڈ وائز، ون ڈیوائس
    کم از کم 500 ڈالر کے ساتھ اپنے اکاؤنٹ کو ٹاپ اپ کریں، مقابلے کے لیے سائن اپ کریں، اور موبائل ڈیوائسز جیتنے کا موقع حاصل کریں۔
    مقابلہ میں شامل ہوں
  • 100 فیصد بونس
    اپنے ڈپازٹ پر 100 فیصد بونس حاصل کرنے کا آپ کا منفرد موقع
    بونس حاصل کریں
  • 55 فیصد بونس
    اپنے ہر ڈپازٹ پر 55 فیصد بونس کے لیے درخواست دیں
    بونس حاصل کریں
  • 30 فیصد بونس
    ہر بار جب آپ اپنا اکاؤنٹ ٹاپ اپ کریں تو 30 فیصد بونس حاصل کریں
    بونس حاصل کریں

تجویز کردہ مضامین

ابھی فوری بات نہیں کرسکتے ؟
اپنا سوال پوچھیں بذریعہ چیٹ.
Widget callback