Analysis of Monday's trades:
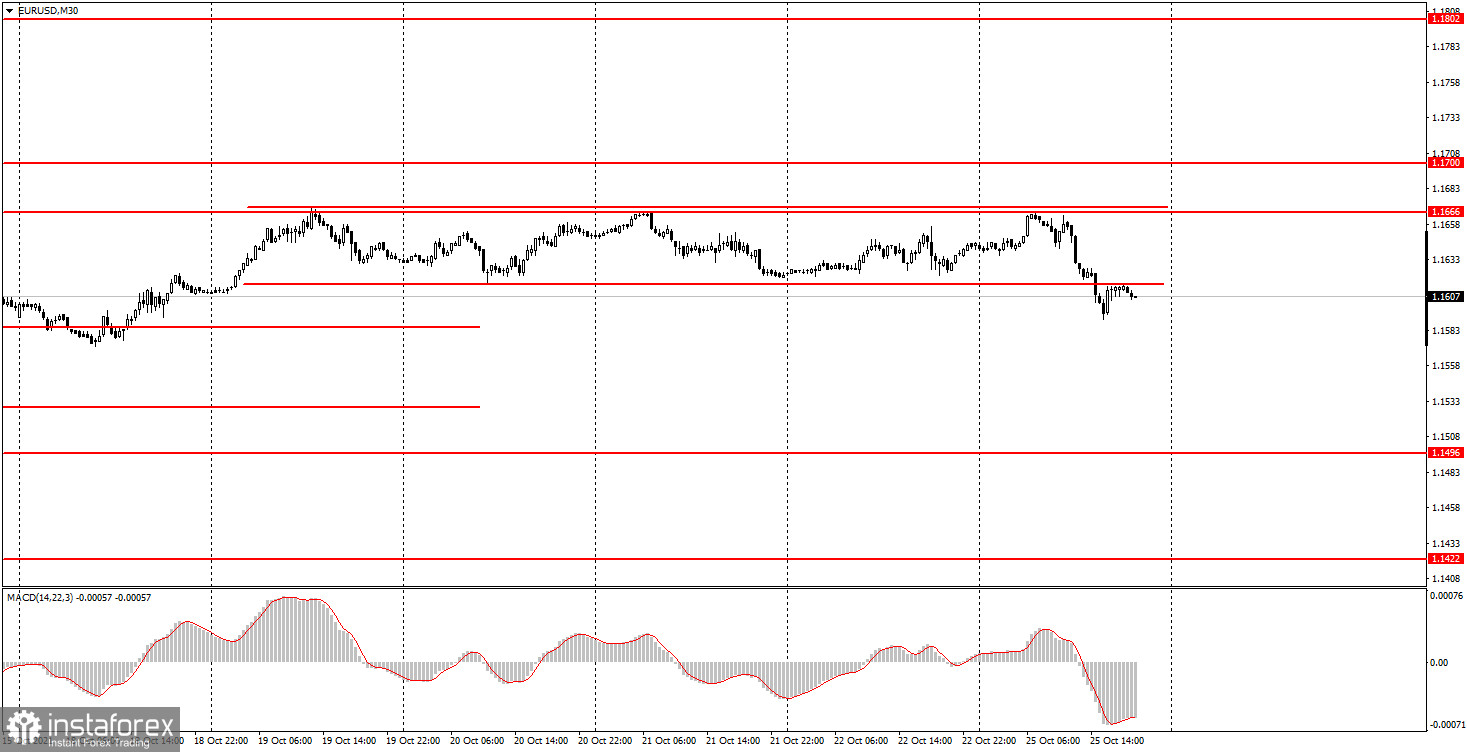
30M chart of EUR/USD
Compared to the dynamics in the last several months, EUR/USD was traded rather actively on Monday. It moved by 75 pips from a low to a high, and also it broke out of the second in the past few weeks sideways channel. So, we can expect the resumption of the downward movement unless the pair get stuck in a third channel which cannot be ruled out. No macroeconomic statistics came out on Monday, so newbie traders had nothing to pay attention to. However, we would not jump to conclusions about trend formation at this time. There has been no trend line in the pair for a long time, so the signals from the MACD indicator can still be ignored. In general, the pair continues to move extremely sluggishly not taking into account today's dynamics. In most cases, the volatility is so low that beginners cannot open trades.
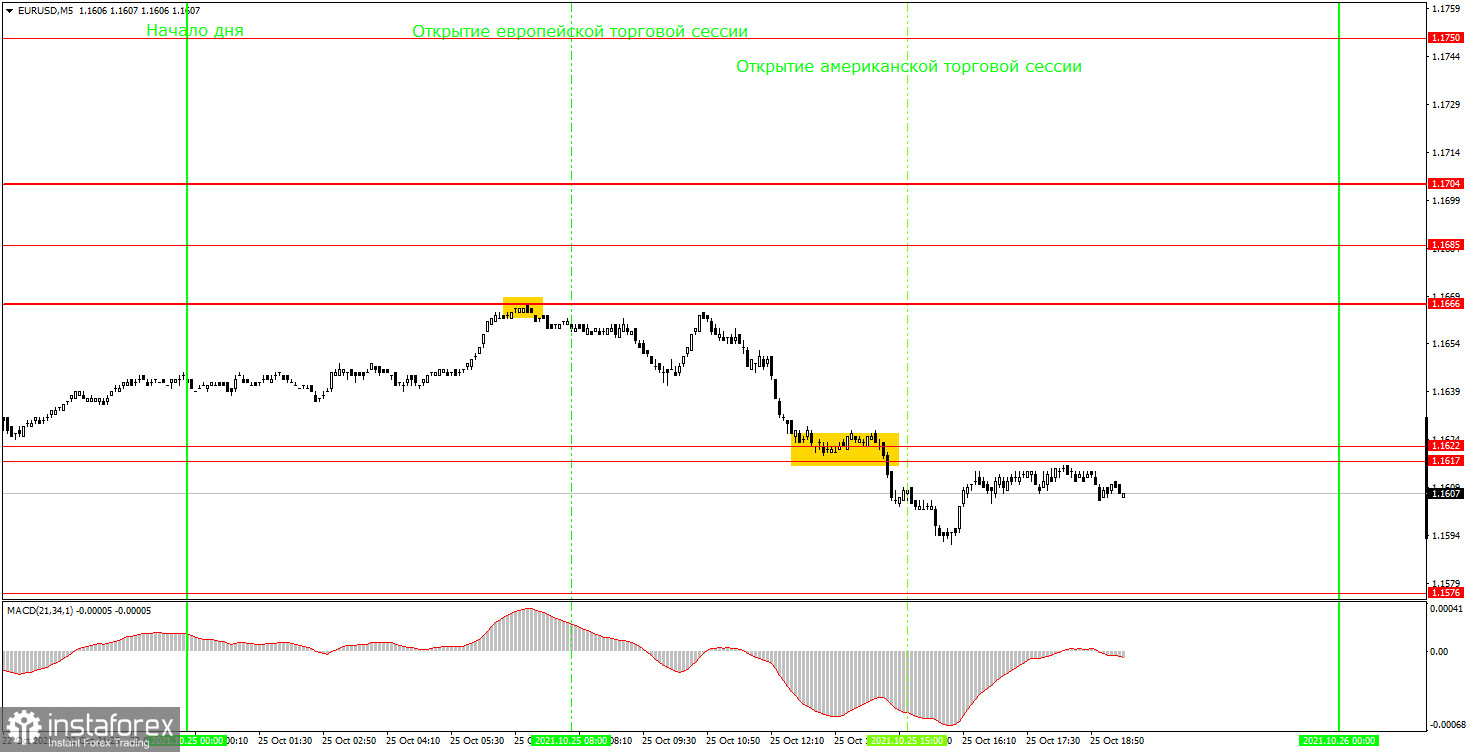
5M chart of EUR/USD
On the 5M chart, the technical picture looks quite good. It's a pity that days such as today are a rare occasion. Overall, there have been only two trading signals during the day, but both these signals proved to be effective as they showed the trend movements. The first sell signal was formed before the opening of the European session. Later on, when the session started, the price moved away from the level where the signal had been formed, and the selling opportunity appeared at 1.1659. After that, the pair moved down and broke the support levels of 1,1622 – 1,1617. As there was no rebound, sell deals remained reasonable. As a result, the quotes went down 65 pips after the sell signal had been formed. It would have been enough for any of our Take Profit levels to be triggered. There were no other trading signals during the day, so beginners managed to profit 30-40 pips.
Trading plan for Tuesday, October 26:
As seen on the 30M chart, the pair has finally broken out of the sideways channel, but no definite trend has been formed so far. So, the 30M time frame is not convenient for trading currently, and we still do not recommend following MACD signals. On the 5M time frame, the key levels for October 26 are 1.1576, 1.1617 – 1.1622, 1.1666, and 1.1685. As usual, the Take Profit level should be set at the distance of 30-40 pips. The Stop Loss can be set at 15 pips. In the 5M chart, the target can be found at the closest level unless it is not too close or too far. If it is, then it is better to focus on the Take Profit. The only event that will be worth our attention on Tuesday will be the Consumer Confidence data from the United States. However, this report is unlikely to cause any strong reaction from market participants. Also, the volatility is unlikely to be as high as it was today.
The basic principles of the trading system:
1) The strength of the signal depends on the time period during which the signal was formed (a rebound or a break)/ The shorter this period, the stronger the signal.
2) If two or more trades were opened at some level following false signals, i.e. those signals that did not lead the price to Take Profit level or the nearest target levels, then any consequent signals near this level should be ignored.
3) During the flat trend, any currency pair may form a lot of false signals or do not produce any signals at all. In any case, the flat trend is not the best condition for trading.
4) Trades are opened in the time period between the beginning of the European session and until the middle of the American one when all deals should be closed manually.
5) We can pay attention to the MACD signals in the 30M time frame only if there is good volatility and a definite trend confirmed by a trend line or a trend channel.
6) If two key levels are too close to each other (about 5-15 pips), then this is a support or resistance area.
How to read charts:
Support and Resistance price levels can serve as targets when buying or selling. You can place Take Profit levels near them.
Red lines are channels or trend lines that display the current trend and show which direction is better to trade.
MACD indicator (14,22,3) is a histogram and a signal line that signal to enter the market when they cross. This indicator is better to be used in combination with trend channels or trend lines.
Important speeches and reports that are always reflected in the economic calendars can greatly influence the movement of a currency pair. Therefore, during such events, it is recommended to trade as carefully as possible or exit the market in order to avoid a sharp price reversal against the previous movement.
Beginning traders should remember that every trade cannot be profitable. The development of a reliable strategy and money management are the key to success in trading over a long period of time.