empty
 
 
28.09.2022 09:43 PM
Technical analysis of EUR/USD for September 28, 2022

This image is no longer relevant

Overview :

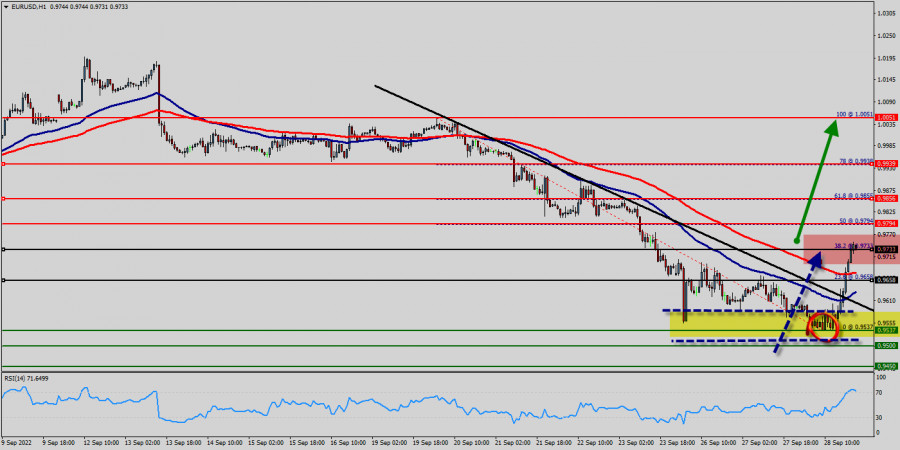
Trend in the EUR/USD pair was argumentative as it was trading in a narrow sideways channel, the market showed signs of instability. Amid the previous events, the price is still moving between the levels of 0.9537 and 0.9794.

Resistance and support are seen at the levels of 0.9537 (also, the double top is already set at the point of 0.9537) and 0.9658 respectively. Therefore, it is recommended to be cautious while placing orders in this area. So, we need to wait until the sideways channel has completed.

The current price is seen at 0.9730 USD which represents a key level today. The level of 0.9730 will act as the daily pivot point on the hourly chart. The EUR/USD pair broke resistance at 0.9973 which turned into strong support yesterday. This level coincides with 38.2% of Fibonacci retracement which is expected to act as major support today. Equally important, the RSI is still signaling that the trend is upward, while the moving average (100) is headed to the upside.

Accordingly, the bullish outlook remains the same as long as the EMA 100 is pointing to the uptrend. This suggests that the pair will probably go above the daily pivot point (0.9730 ) in the coming hours. The EUR/USD pair will demonstrte strength following a breakout of the high at 0.9730.

This suggests that the pair will probably go above the daily pivot point (0.9730) in the coming hours. The EUR/USD pair will demonstrate strength following a breakout of the high at 0.9730.

Consequently, the market is likely to show signs of a bullish trend. In other words, buy orders are recommended above 0.9730 with the first target at 0.9794.

Then, the pair is likely to begin an ascending movement to 0.9800 mark and further to 0.9856 levels.

The level of 0.9939 will act as strong resistance, and the double top is already set at 1.0051.

On the other hand, the daily strong support is seen at 0.9658. If the EUR/USD pair is able to break out the level of 0.9658, the market will decline further to 0.9537 (daily support 2).

Uptrend scenario :

An uptrend will start as soon, as the market rises above resistance level 0.9733, which will be followed by moving up to resistance level 0.9794. Further close above the high end may cause a rally towards 0.9856 and 0.9939. Nonetheless, the weekly resistance level and zone should be considered at 1.0051.

Alternative scenario : The breakdown of 0.5658 will allow the pair to go further down to the prices of 0.6537 and 0.9500.

انسٹافاریکس کے ساتھ کرپٹو کرنسی کی معاملاتی تبدیلیوں سے کمائیں۔
میٹا ٹریڈر 4 ڈاؤن لوڈ کریں اور اپنی پہلی ٹریڈ کھولیں۔
  • Grand Choice
    Contest by
    InstaForex
    InstaForex always strives to help you
    fulfill your biggest dreams.
    مقابلہ میں شامل ہوں
  • چانسی ڈیپازٹ
    اپنے اکاؤنٹ میں 3000 ڈالر جمع کروائیں اور حاصل کریں$1000 مزید!
    ہم اپریل قرعہ اندازی کرتے ہیں $1000چانسی ڈیپازٹ نامی مقابلہ کے تحت
    اپنے اکاؤنٹ میں 3000 ڈالر جمع کروانے پر موقع حاصل کریں - اس شرط پر پورا اُترتے ہوئے اس مقابلہ میں شرکت کریں
    مقابلہ میں شامل ہوں
  • ٹریڈ وائز، ون ڈیوائس
    کم از کم 500 ڈالر کے ساتھ اپنے اکاؤنٹ کو ٹاپ اپ کریں، مقابلے کے لیے سائن اپ کریں، اور موبائل ڈیوائسز جیتنے کا موقع حاصل کریں۔
    مقابلہ میں شامل ہوں
  • 100 فیصد بونس
    اپنے ڈپازٹ پر 100 فیصد بونس حاصل کرنے کا آپ کا منفرد موقع
    بونس حاصل کریں
  • 55 فیصد بونس
    اپنے ہر ڈپازٹ پر 55 فیصد بونس کے لیے درخواست دیں
    بونس حاصل کریں
  • 30 فیصد بونس
    ہر بار جب آپ اپنا اکاؤنٹ ٹاپ اپ کریں تو 30 فیصد بونس حاصل کریں
    بونس حاصل کریں

تجویز کردہ مضامین

ابھی فوری بات نہیں کرسکتے ؟
اپنا سوال پوچھیں بذریعہ چیٹ.
Widget callback