Here are the details of the economic calendar for December 2, 2021
The Eurozone's unemployment rate was 7.4%, which was not something unexpected for the market. At the same time, the growth rate of producer prices in the EU accelerated from 16.1% to 21.9% with a forecast of 19%.
The Euro currency has strengthened locally within the current amplitude, but there have been no drastic changes.
During the US trading session, America's data on applications for unemployment benefits were published. It was predicted that the indicators would remain at the same level, but we saw a significant reduction in volume.
Details of statistics:
The volume of initial applications for benefits rose from 194 thousand to 222 thousand, against the expected growth of 240 thousand.
The volume of repeated applications for benefits decreased from 2,063 thousand to 1,956 thousand, against the forecast of 2,000 thousand.
The divergence of expectations pushed traders to buy the US dollar.
Analysis of trading charts from December 2:
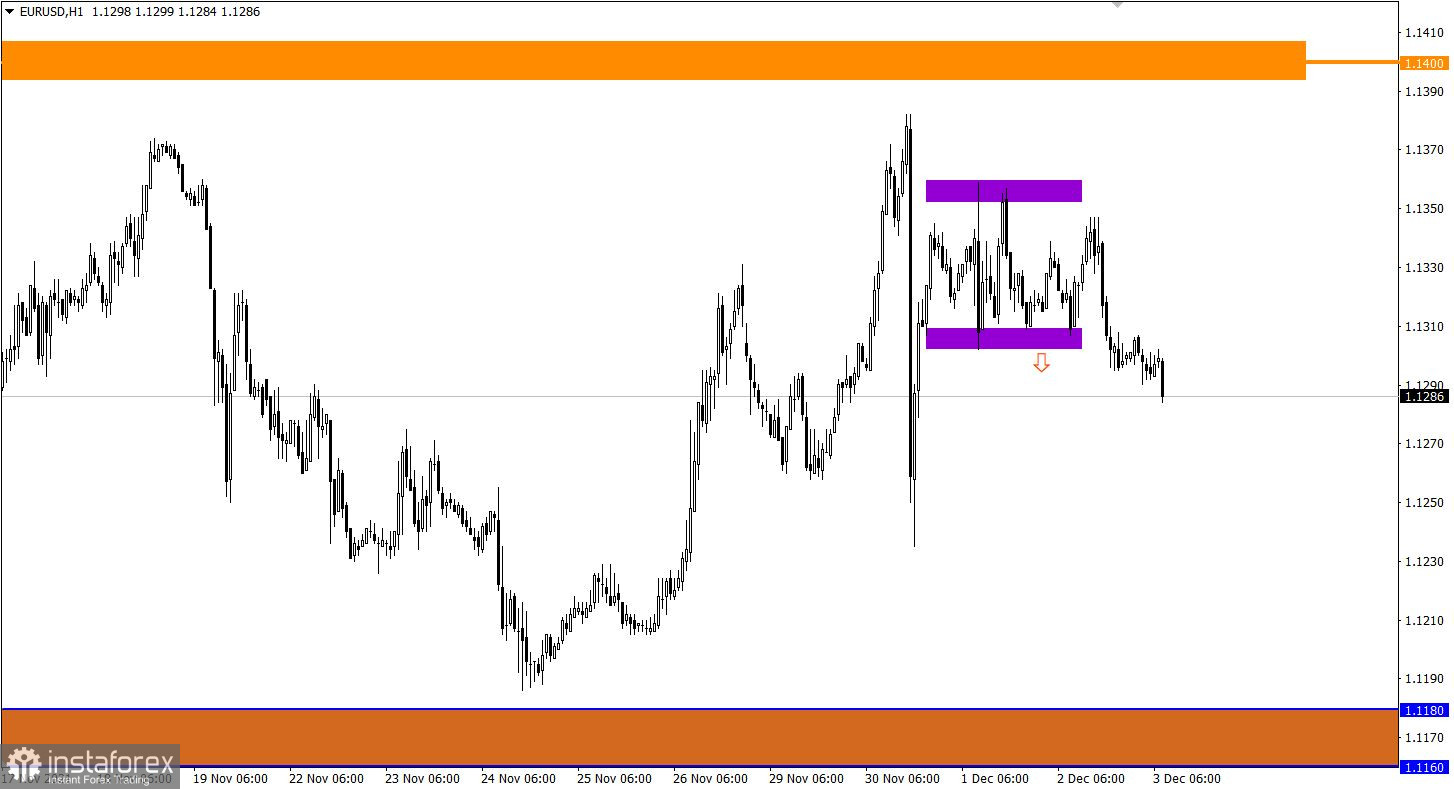
The EUR/USD pair overcame its lower limit during the formation of the 40-hour range 1.1300/1.1355. This indicates the prevailing downward interest among market participants.
A downward trend persists on the daily chart, in the structure of which a correction cycle has arisen, and then stagnation.
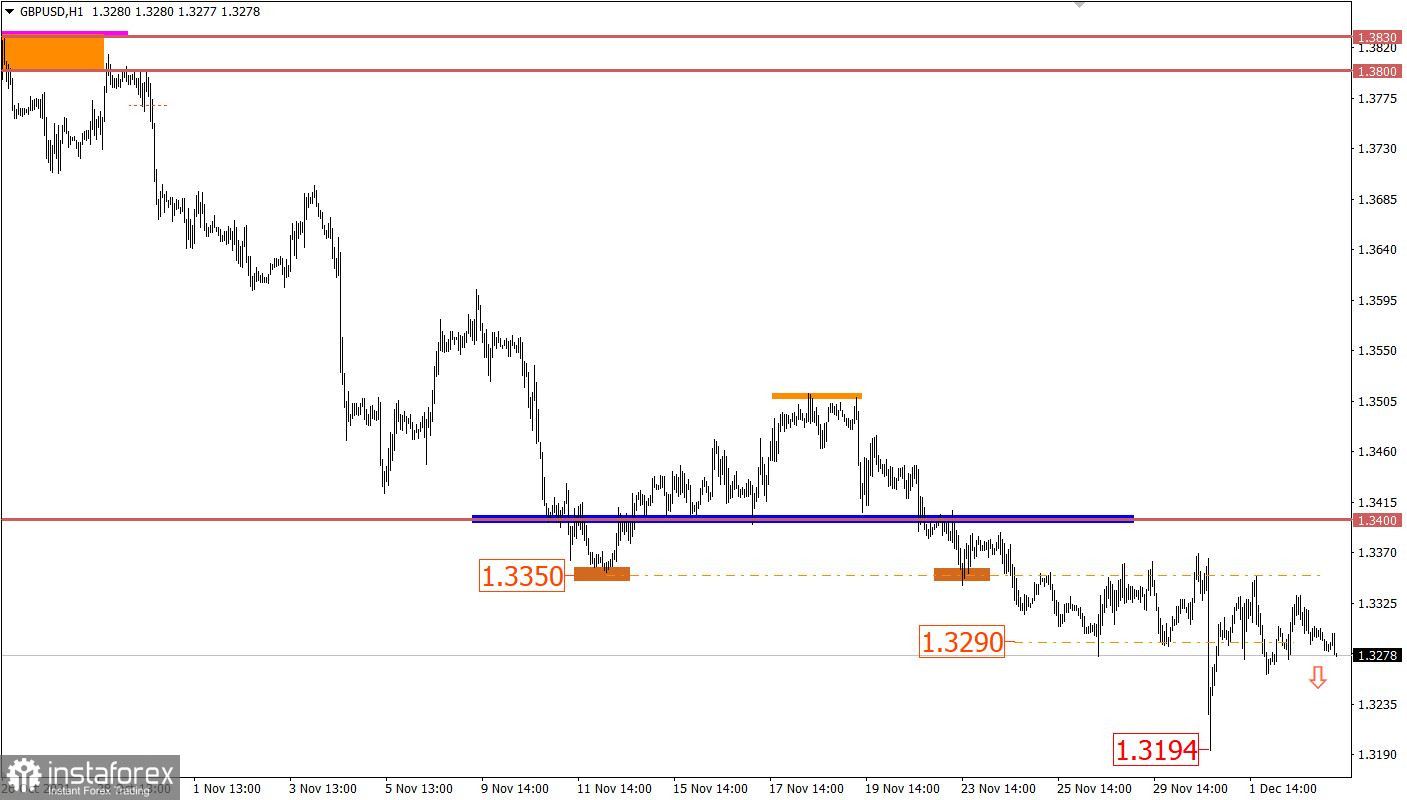
The GBP/USD pair still adheres to a downward mood despite the variable swing within the previously broken range of 1.3290/1.3350. This is indicated by the stable return of the price below the level of 1.3290.
December 3 economic calendar:
In terms of the economic calendar, the EU's retail sales data will be published, where it is predicted that their growth rate will slow down from 2.5% to 1.0%. We are talking about a decline in consumer activity, which is the main driver of economic growth.
Therefore, the Euro currency may be under pressure from sellers.
A report by the United States Department of Labor will be released at 13:30 Universal time, which is considered one of the most important economic events in the finance world.
Details:
The unemployment rate in November is expected to fall from 4.6% to 4.5%.
550 thousand new jobs can be created outside agriculture, compared to 530 thousand in the previous reporting period.
As can be seen from the details of statistical expectations, experts predict a further recovery process, and this may lead to an increase in the US dollar if expectations coincide.
Trading plan for EUR/USD on December 3:
Stable price retention below the level of 1.1300 in a four-hour period increases the chances of sellers for a subsequent decline. This may lead to the euro's gradual weakening in the future, initially to the local low (1.1235) of November 30, and then to the area of interaction of trade forces 1.1160/1180.
Traders will consider an alternative scenario of the market development in case of resumption of the lateral amplitude 1.1300/1.1355.
Trading plan for GBP/USD on December 3:
In this situation, it is not enough just to keep the price below the level of 1.3290. A speculative push is needed. This can be helped by the information and news flow, which encourages speculators to act. Here, a subsequent decline towards the local low of 1.3194 is possible.
Traders will consider an alternative scenario for the development of the market in the event of a sharp change in trading interests, for example, if the price is kept above the level of 1.3370.
What is reflected in the trading charts?
A candlestick chart view is graphical rectangles of white and black light, with sticks on top and bottom. When analyzing each candle in detail, you will see its characteristics of a relative period: the opening price, closing price, and maximum and minimum prices.
Horizontal levels are price coordinates, relative to which a stop or a price reversal may occur. These levels are called support and resistance in the market.
Circles and rectangles are highlighted examples where the price of the story unfolded. This color selection indicates horizontal lines that may put pressure on the quote in the future.
The up/down arrows are the reference points of the possible price direction in the future.