GBP/USD 5M
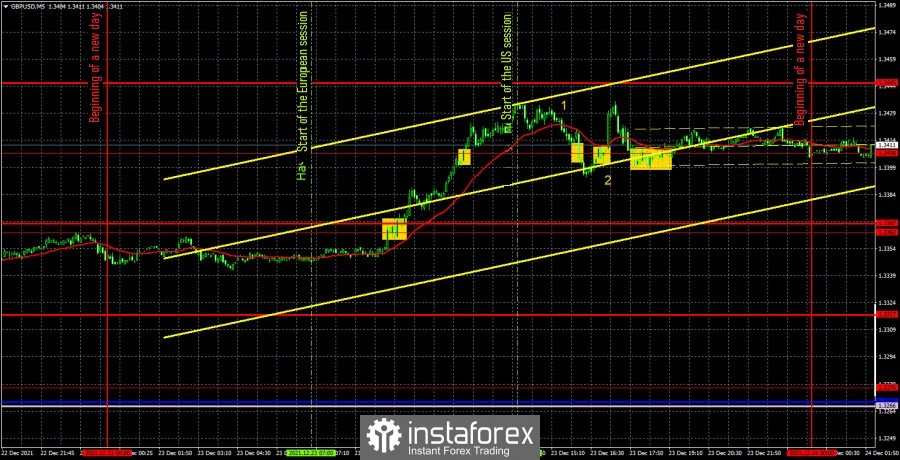
The GBP/USD pair continued to be in an unexpectedly formed upward trend on Thursday. After the price rebounded from the level of 1.3185 once again, a strong upward movement began and the pair has already gone up about 250 points in just four days. Thus, the pound is now being blown away "for itself and for the other." However, this is very good, because at the same time the pair gives traders the opportunity to earn, and not just wait for Christmas and New Year "on the fence". At this time, a new upward trend line has even been formed, which supports the pound bulls. In principle, we also support the British currency's further growth, as we have been waiting for it over the past months. All statistics of the penultimate trading day were published only in the US. We have already analyzed it in the euro/dollar review. In short: the markets reacted very sluggishly to all the reports, as we expected. And the pound's upward movement by 20 points in five minutes cannot even be tied to the only more or less important report that was published at that time – the consumer sentiment index from the University of Michigan. Now let's move on to Thursday's trading signals. The first one was formed in the middle of the European session, when the pair overcame the extreme level of 1.3362. Traders had to open long positions on it. Subsequently, the price continued to move up and also overcame the extreme level of 1.3406, but it could not reach the resistance level of 1.3445 and by the middle of the US session it fell below the level of 1.3406. At this point, it was necessary to close the long positions. The profit was about 30 points. It was also necessary to open positions at the signal of consolidating below the level of 1.3406, but already short ones. Unfortunately, this signal turned out to be false, and the price settled above the level of 1.3406. It was at this moment that the consumer sentiment index was supposed to be published. And even though it did not provoke any reaction, it was still necessary not to risk and close the shorts before this signal. But a small loss was still received. Then there was a buy signal when the pair settled above the level of 1.3406. It should have been ignored, since at the time of its formation, the price was already above the level by a good 20 points. The last signal near the level of 1.3406 should have been ignored, as it was formed too late.
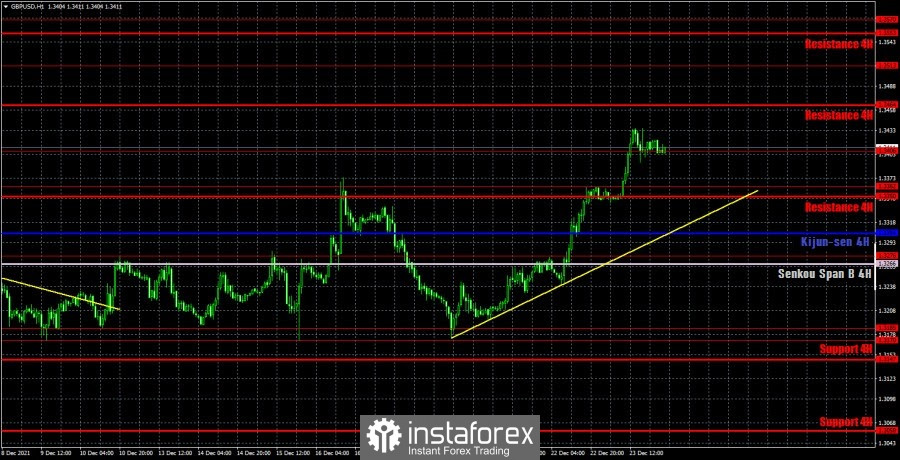
GBP/USD 1H

On the hourly timeframe, the pound/dollar pair has left the horizontal channel, a new upward trend has formed. Surprisingly, the pair shows quite good volatility at the end of the year, and the pound - a desire to grow in price. Thus, until the price settles below the trend line, we look forward to the continuation of the upward movement. We distinguish the following important levels on December 24: 1.3276, 1.3362, 1.3406, 1.3513. Senkou Span B (1.3266) and Kijun-sen (1.3304) lines can also be signal sources. Signals can be "rebounds" and "breakthroughs" of these levels and lines. It is recommended to set the Stop Loss level at breakeven when the price passes 20 points in the right direction. The Ichimoku indicator lines can move during the day, which should be taken into account when looking for trading signals. The calendars of macroeconomic events are empty in the US and the UK on Friday, so there will be no impact on the movement of the pound/dollar pair. However, the pair may continue to show enviable activity and volatility as it is not currently inside a horizontal channel.
We recommend you to familiarize yourself:
Overview of the EUR/USD pair. December 24. What are the prospects for the pair in the coming months?
Overview of the GBP/USD pair. December 24. The pound is ready to rise another 200-300 points.
Forecast and trading signals for EUR/USD for December 24. Detailed analysis of the movement of the pair and trade deals.
COT report
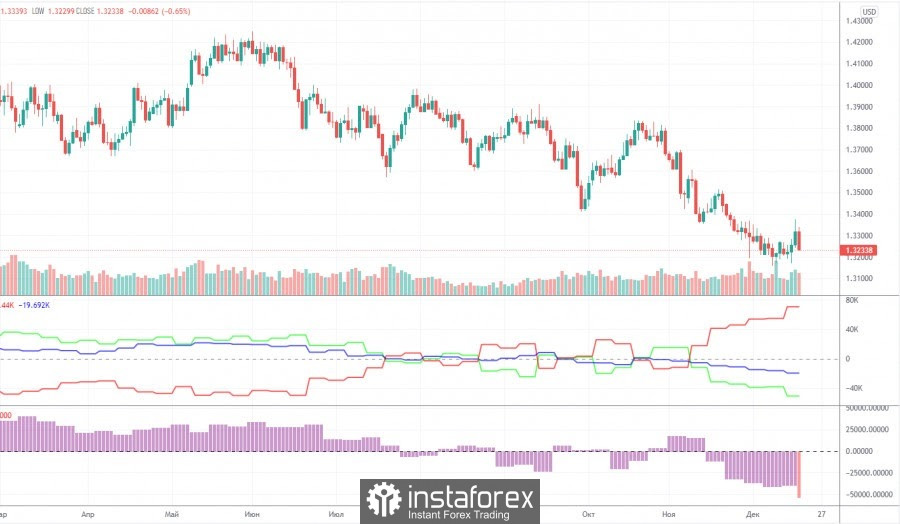
The mood of commercial traders was much more bearish during the last reporting week (December 7-13). Commercial traders closed 6,700 sell contracts (shorts) and 20,100 buy contracts (longs) during the week. Thus, the net position for the "non-commercial" group of traders decreased by 13,400 contracts, which is a lot for the pound. Thus, unlike the euro currency, the pound, according to COT reports, continues to fall quite reasonably: major players continue to sell it. However, the green and red lines of the first indicator (which mean the net positions of the non-commercial and commercial groups) have already moved far away from each other. Recall that such a deletion signals the imminent end of the trend. However, as with any fundamental assumptions, specific technical signals are required to work out this hypothesis, which are not currently available. If we do not take into account the increase in the key rate by the Bank of England, then there are no special fundamental reasons for the growth of the pound now either. Recall that Prime Minister Boris Johnson continues to get into various scandals in Great Britain and there is already talk that he will leave his post before the end of the deadline. The pandemic in the UK is gaining momentum and the other day an anti-record was set for the daily number of infections. Omicron is also spreading quite rapidly across the country, creating additional risks for the healthcare system and the economy. London, on the other hand, cannot find a common language with Paris and Brussels, which threatens it with the deterioration of relations with its closest neighbors and the loss of markets for the sale of products. But there is no positive news.
Explanations for the chart:
Support and Resistance Levels are the levels that serve as targets when buying or selling the pair. You can place Take Profit near these levels.
Kijun-sen and Senkou Span B lines are lines of the Ichimoku indicator transferred to the hourly timeframe from the 4-hour one.
Support and resistance areas are areas from which the price has repeatedly rebounded off.
Yellow lines are trend lines, trend channels and any other technical patterns.
Indicator 1 on the COT charts is the size of the net position of each category of traders.
Indicator 2 on the COT charts is the size of the net position for the non-commercial group.