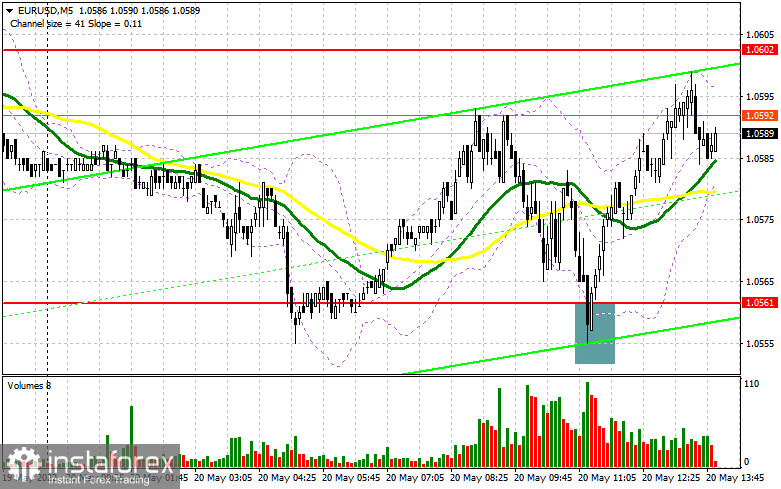
In the morning article, I highlighted the level of 1.0561 and recommended taking decisions with this level in focus. Now let's look at the 5-minute chart and try to figure out what actually happened. With the economic calendar being empty, bears tried to exert pressure on the euro. However, they failed to push the price below 1.0561. As a result, an excellent buy signal appeared after a false breakout. Thus, the bullish momentum prevailed again. The pair rose by 40 pips. The technical outlook for the second half of the day has not changed as well as the strategy.
What is needed to open long positions on EUR/USD
The main task of bulls today is to protect the support level of 1.0561. They have already managed to defend this level twice today. Only after a false breakdown at this level, it is recommended to buy the euro with the prospect of a breakout of 1.0602. The moving averages are passing just below 1.0561, which can also help bulls. The breakout and a downward test of 1.0602 will give a new buy signal. However, a sharper rise is possible only if the Euro Area Consumer Confidence indicator for May is positive. Analysts forecast its further decline. If the price jumps above 1.0602, the nearest target level will be a high of 1.0640 where I recommend locking in profits. The next target level will be 1.0691. Yet, it will be quite hard for the pair to approach this level. If the pair drops and bulls show no activity at 1.0561, which is quite possible as this level has already been protected twice, the pressure on the pair will quickly return. Traders will start closing positions to lock in profits at the end of the week. If so, it would be appropriate to open long positions after a false breakout near the low of 1.0521. I would advise you to open long positions immediately at a bounce from 1.0486 or a low around 1.0452, keeping in mind an upward intraday correction of 30-35 pips.
What is needed to open short positions on EUR/USD
If the pair resumes growth, only a false breakout of 1.0602, which did not happen this morning, along with the MACD divergence will give a sell signal with the prospect of a decrease to the support level of 1.0561. Bulls and bears are unlikely to tussle for this level as it has already been broken several times. Therefore, a breakout and a drop below this level, as well as an upward test will generate a new sell signal, erasing buyers' stop orders. As a result, a sharp decline to 1.0521 may occur where I recommend locking in profits. A more distant target will be the 1.0486 level. However, the pair is sure to reach this level only if the bullish momentum loses steam at the end of this week. If EUR/USD rises in the afternoon and bears show no energy at 1.0602, the uptrend may continue, indicating the likelihood of a new bullish trend. If so, it would be wise to open short positions after a false breakout of 1.0640. You can sell EUR/USD immediately at a bounce from 1.0691 or even a high around 1.0736, keeping in mind a downward intraday correction of 30-35 pips.
COT report
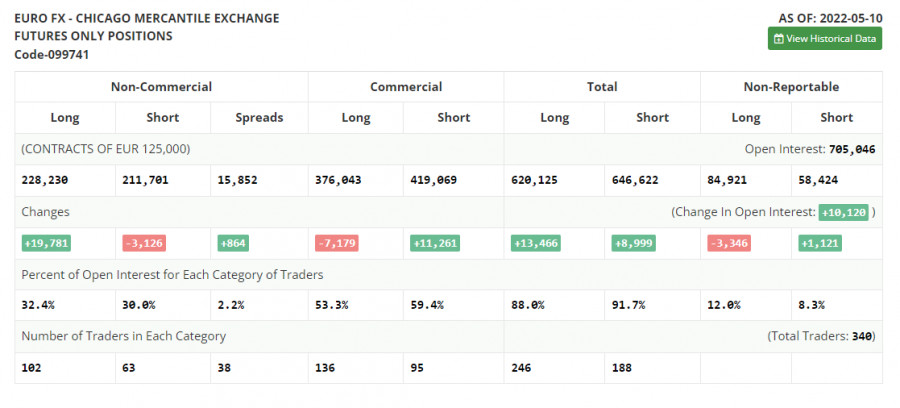
The COT report (Commitment of Traders) for May 10 logged a sharp increase in long positions and a drop in short ones. The euro's oversold status indicates interest from traders and investors. ECB policymakers' recent statements fueled optimism that the euro may be able to start an upward cycle. The ECB is widely expected to raise the key rate by a quarter-point in July this year, then in September and in December, bringing it to 0.25% by the end of the year. The next rate hikes will follow in September and in December from the current zero level to 0.5%. Such an aggressive tightening will help euro bulls to find the bottom in the near future. However, the US Fed alongside escalating geopolitical tensions might derail such plans. The US regulator sticks to aggressive monetary policy tightening. Some analysts believe that at the next meeting the central bank may raise the key rate by 0.75%. This scenario gives a clear signal to buy the US dollar in the medium term. The COT report revealed that long non-commercial positions jumped by 19,781 from 208,449 to 228,230, while short mom-commercial positions dropped by 3,126 from 214,827 to 211,701. As I have already noted, the low rate of the euro makes it more attractive for traders. Currently, we see that more buyers are entering the market. At the end of the week, the total non-commercial net position increased to 16,529 against a negative indicator of -6,378 a week earlier. The weekly closing price remained practically unchanged at 1.0546 versus 1.0545.
Signals of technical indicators
Moving averages
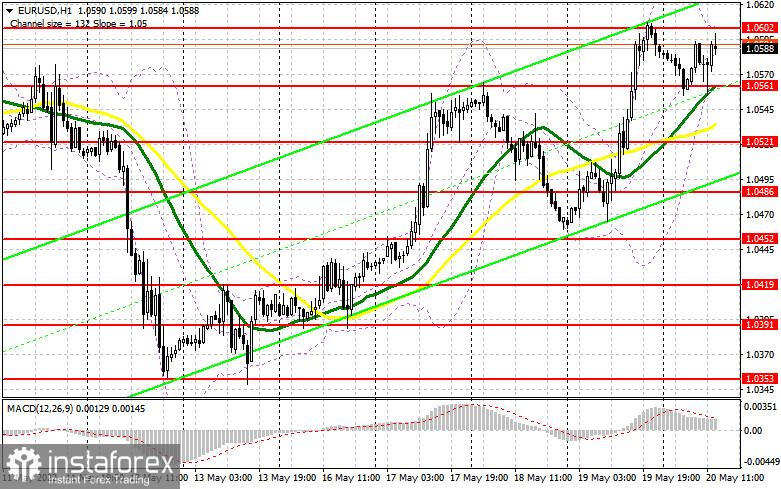
EUR/USD is trading above 30- and 50-period moving averages, indicating a further rise in the euro.
Remark. The author is analyzing the period and prices of moving averages on the 1-hour chart. So, it differs from the common definition of classic daily moving averages on the daily chart.
Bollinger Bands
In case of a decline, the lower border of 1.0560 will act as support.
Definitions of technical indicators
- Moving average recognizes an ongoing trend through leveling out volatility and market noise. A 50-period moving average is plotted yellow on the chart.
- Moving average identifies an ongoing trend through leveling out volatility and market noise. A 30-period moving average is
- displayed as the green line.
- MACD indicator represents a relationship between two moving averages that is a ratio of Moving Average Convergence/Divergence. The
- MACD is calculated by subtracting the 26-period Exponential Moving Average (EMA) from the 12-period EMA. A 9-day EMA of the MACD called the "signal line".
- Bollinger Bands is a momentum indicator. The upper and lower bands are typically 2 standard deviations +/- from a 20-day simple moving
- average.
- Non-commercial traders - speculators such as retail traders, hedge funds, and large institutions who use the futures market for speculative purposes and meet certain requirements.
- Non-commercial long positions represent the total long open position of non-commercial traders.
- Non-commercial short positions represent the total short open position of non-commercial traders.
- The overall non-commercial net position balance is the difference between short and long positions of non-commercial traders.