empty
 
 
19.08.2022 09:48 AM
BTC approaches important support. Why causes fall in its price and what to expect next

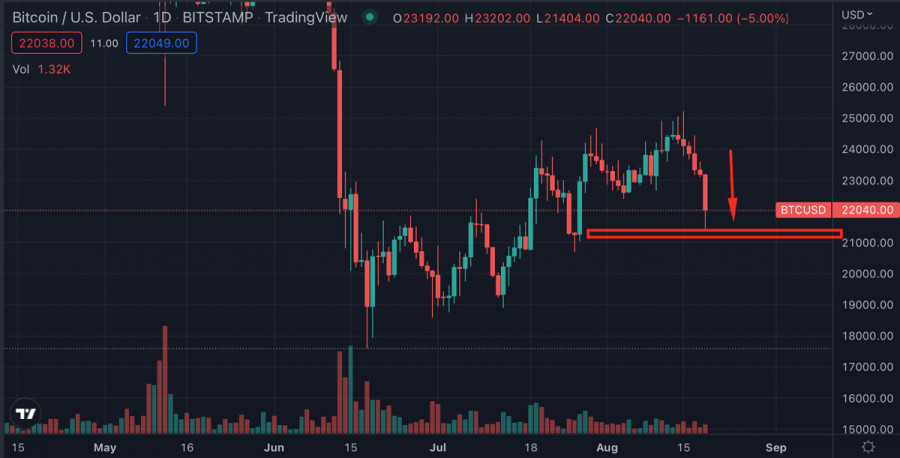
Bitcoin has been bearish since hitting the swing high of $25k. The first bearish signs came last week, but they quickly faded due to the descending triangle of intraday trading volumes and the unsuccessful retest of $25k. In addition, a row of negative fundamental factors exerted pressure on the crypto market. The US dollar index started to recover, while BTC-based crypto funds lost over $20 million last week.

This image is no longer relevant

As a result, digital gold plunged, broke through $23k, and bounced to $21.2k. The steep fall came after a bearish breakout through the range of $22.8k-$23.4k. Consequently, the price tumbled to $21.4k support.

This image is no longer relevant

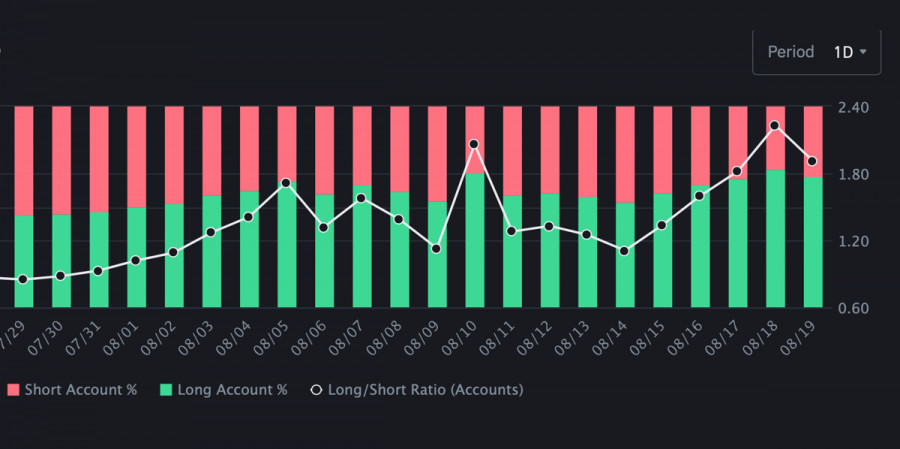
A few more fundamental and technical factors have contributed to the fall in BTC. The FOMC Minutes hinted at the continuation of rate hikes. In addition, the number of long positions grew. The volume of bullish positions has been $1 billion higher than that of bearish positions. And the market, as you know, plays against the majority.

This image is no longer relevant

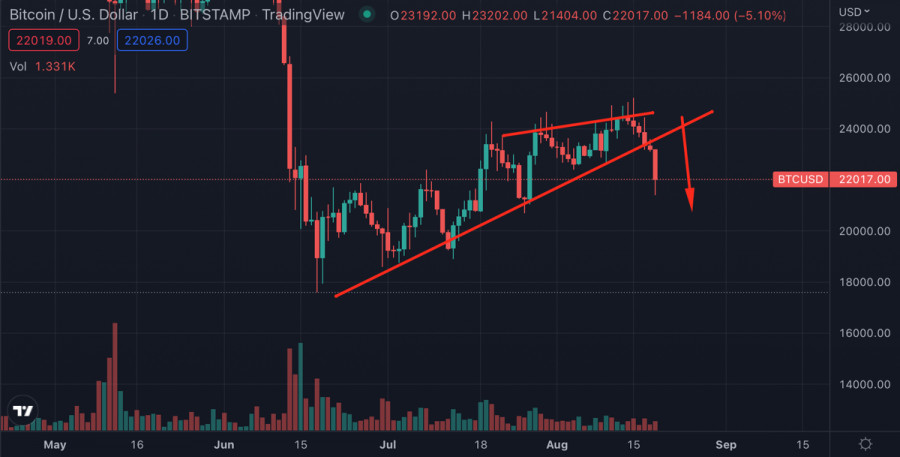
Consequently, the market capitalization of BTC fell by 3.5% in an hour and by 5.7% in a day. The rising wedge pattern headed down, as expected. The bullish trend that emerged on July 18 stopped when the price dropped to $21,4k. Even if bulls recoup losses, the main two bearish targets are still reached: the large volume of long positions was liquidated and the uptrend line was broken.

This image is no longer relevant

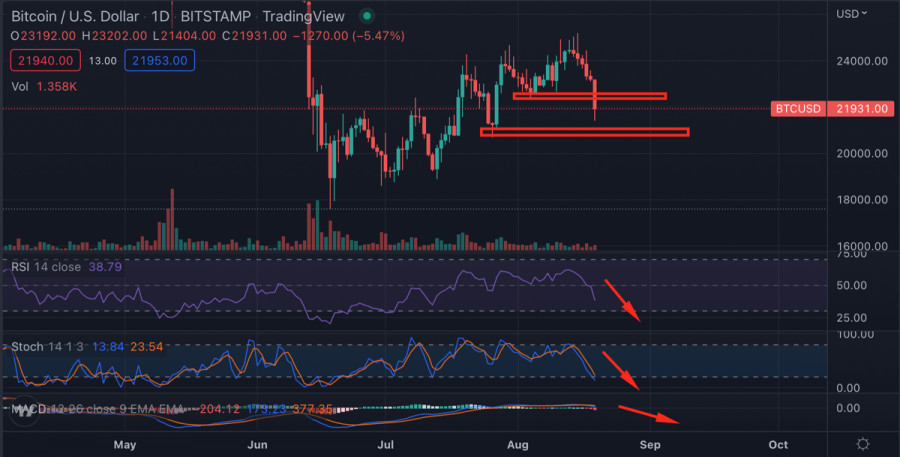
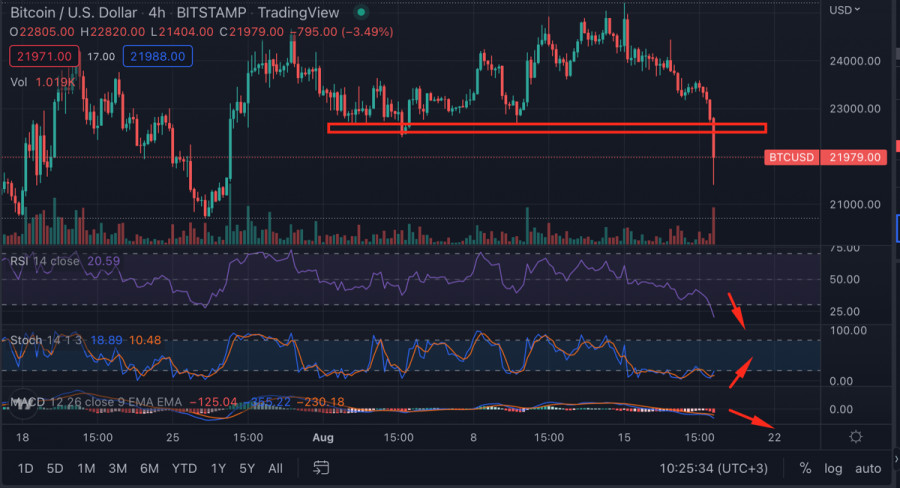
Speaking of a possible rebound above $23k, it is highly unlikely. Technical indicators show the continuation of the bearish trend. The Stochastic Oscillator formed a bearish crossover near 60 and nosedived to the oversold level near 18. The RSI gives no signals of an impending reversal. The MACD started to move down and could enter the red zone soon. These factors reflect bearish power and the likelihood of a retest of $20k.

This image is no longer relevant

On the 4-hour chart, there are the first signs of a recovery. The Stochastic Oscillator shows a bullish crossover in the oversold zone. The indicator has already reached the mark of 22 and is now moving up. The RSI, however, is moving down. Thus, we have a divergence, which means that a bullish impulse is unlikely. Bitcoin has reached a point where low trading volumes make it impossible to defend major support levels. Should the current trend go on, next week would kick off with a retest of $20k.

Artem Petrenko,
انسٹافاریکس کا تجزیاتی ماہر
© 2007-2024
انسٹافاریکس کے ساتھ کرپٹو کرنسی کی معاملاتی تبدیلیوں سے کمائیں۔
میٹا ٹریڈر 4 ڈاؤن لوڈ کریں اور اپنی پہلی ٹریڈ کھولیں۔
  • Grand Choice
    Contest by
    InstaForex
    InstaForex always strives to help you
    fulfill your biggest dreams.
    مقابلہ میں شامل ہوں
  • چانسی ڈیپازٹ
    اپنے اکاؤنٹ میں 3000 ڈالر جمع کروائیں اور حاصل کریں$1000 مزید!
    ہم اپریل قرعہ اندازی کرتے ہیں $1000چانسی ڈیپازٹ نامی مقابلہ کے تحت
    اپنے اکاؤنٹ میں 3000 ڈالر جمع کروانے پر موقع حاصل کریں - اس شرط پر پورا اُترتے ہوئے اس مقابلہ میں شرکت کریں
    مقابلہ میں شامل ہوں
  • ٹریڈ وائز، ون ڈیوائس
    کم از کم 500 ڈالر کے ساتھ اپنے اکاؤنٹ کو ٹاپ اپ کریں، مقابلے کے لیے سائن اپ کریں، اور موبائل ڈیوائسز جیتنے کا موقع حاصل کریں۔
    مقابلہ میں شامل ہوں
  • 100 فیصد بونس
    اپنے ڈپازٹ پر 100 فیصد بونس حاصل کرنے کا آپ کا منفرد موقع
    بونس حاصل کریں
  • 55 فیصد بونس
    اپنے ہر ڈپازٹ پر 55 فیصد بونس کے لیے درخواست دیں
    بونس حاصل کریں
  • 30 فیصد بونس
    ہر بار جب آپ اپنا اکاؤنٹ ٹاپ اپ کریں تو 30 فیصد بونس حاصل کریں
    بونس حاصل کریں

تجویز کردہ مضامین

ابھی فوری بات نہیں کرسکتے ؟
اپنا سوال پوچھیں بذریعہ چیٹ.
Widget callback