The euro/dollar pair is testing new lows, having settled in the 0.97 area. After a short upside correction, bears seized the initiative and pushed the price to the 20-year low. In the near future, the pair is unlikely to go below this benchmark level. Back in 2002, EUR/USD dropped to the area of 0.85. So, it seems that a decline of 1,500 pips from the parity level that took place in 2002 is the record that the pair won't beat anytime soon.

It is the tendency that we need to pay attention to. It is worth noting that sellers were gaining momentum slowly. First, they started to test the parity level in the middle of summer but did not stay below the 1.0000 mark for too long. Later, bears entered the area of 0.99, thus expanding their area of control. Finally, they managed to push the price below the parity level, and this is how the mark of 1.0000 turned into resistance instead of support. So, what is happening now is hardly surprising as the downtrend has been developing slowly and steadily.
The current fundamental background supports the bearish trend. For instance, the US Federal Reserve has once again confirmed its hawkish stance on monetary policy at its September meeting. Meanwhile, the euro is under pressure from the energy crisis, a looming recession, and continued inflation growth. The PMI data published today clearly displays the existing business sentiment in the European region. The euro has shown its vulnerability once again, thus proving the relevance of short positions. Notably, even despite the fact that today is the last trading day of the week, traders do not rush to take profit but open sell positions instead. Naturally, this exerts more pressure on the pair.
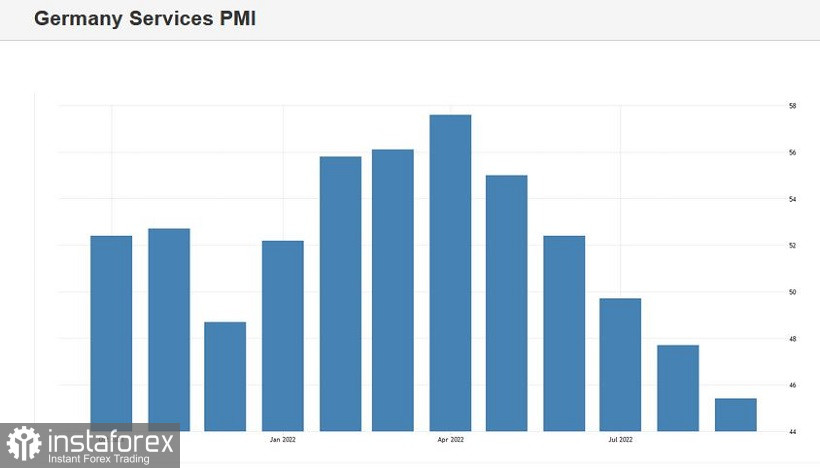
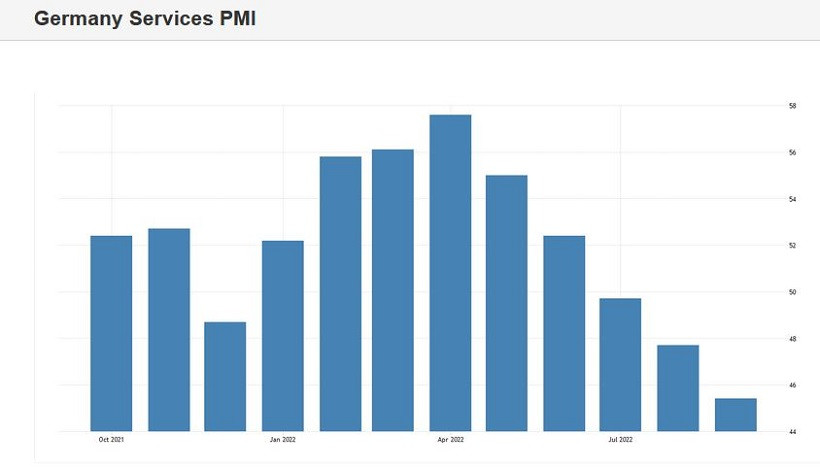
The PMI data from major European countries clearly reveals growing pessimism in the region: the manufacturing sector, as well as the services sector, is falling rapidly. The preliminary estimates for September that were issued today allow us to evaluate the key economic indicators. Thus, in France, the PMI in the manufacturing sector dropped to 47.8, its lowest level since May 2020. Likewise, Germany's manufacturing PMI plunged to 48.3. This reading was last recorded in June 2020. Therefore, we can see that the indicator has been gradually decreasing since February this year. For your reference, in early 2022, it was holding in the area of 65. The eurozone manufacturing PMI is also in the red, having declined to 48.5. The situation is even worse in the services sector. In Germany, the indicator fell to the level of 45, hitting the 2-year low. The decline has been going on since April this year.
Apparently, the PMI data added fuel to the already pessimistic fundamental background and acted as a trigger. The pair is tumbling on mounting fears over the worsening global economic crisis, rising geopolitical tensions, and more rate hikes by the Fed. The energy crisis serves as an additional downside factor for the euro which allows bears to steadily develop the downtrend. The European Central Bank seems helpless in this situation. Its latest decision to tighten monetary policy caused only a short-term correction but nothing more.
Therefore, the strategy to go short on upside pullbacks seems the most relevant one at this time. Yet, it is better to sell the pair when the corrective movement is coming to an end. As a rule, every strong downside movement is usually followed by a short correction. The recent events have confirmed that the bearish trend is still in place. The current price channel is found in the range between 0.9750 and 0.9950. The pair continues to move further away from the parity level.
The same is confirmed by technical indicators. On all higher time frames starting from H4, the price is holding either at the lower band of the Bollinger Bands indicator or between its middle and lower lines. This is a clear sign of the downward trend. The Ichimoku indicator has formed a bearish signal called the Alignment on H4 and D1 charts. This happens when the price is found below all the lines of the indicator, including the Kumo Cloud, and serves as a confirmation of the bearish sentiment. The key support level (the main downside target) is located at 0.9710 which is the lower band of the Bollinger Bands indicator on the weekly chart. The pair is unlikely to move lower given the end-of-the-week factor and the recent test of 20-year lows.