The euro/dollar currency pair failed to slow down the upward trend, and as a result, the last week ended with a new local peak. From technical analysis, we see an almost unchanged picture in the form of an inertial upward move, where there were no corrections and rollbacks. The existing move drew a vertical growth line in the market with small stops in the form of consolidation, where temporary regrouping of trading forces took place. The characteristic overbought has been hanging on the market for several days, and it does not frighten the market participants a bit, thereby once again confirming the effect of the emotional mood.
Analyzing the hourly Friday day, we see that after a slight accumulation in the area of 1.1110/1.1130, during the Pacific and Asian trading sessions, there was a characteristic regrouping of trading forces, followed by a surge of buyers in the period of 10:00-23:00 hours (time on the trading terminal).
As discussed in the previous review, speculators had the best profitability among all traders, therefore, is even outside the market, they felt comfortable. Of course, not all traders decided to take a short vacation, as the remarkable morning accumulation of 1.1110/1.1130 provided an excellent platform to enter the market. Thus, the method of working on the breakdown of existing boundaries was an excellent tactic, which as a result brought profit.
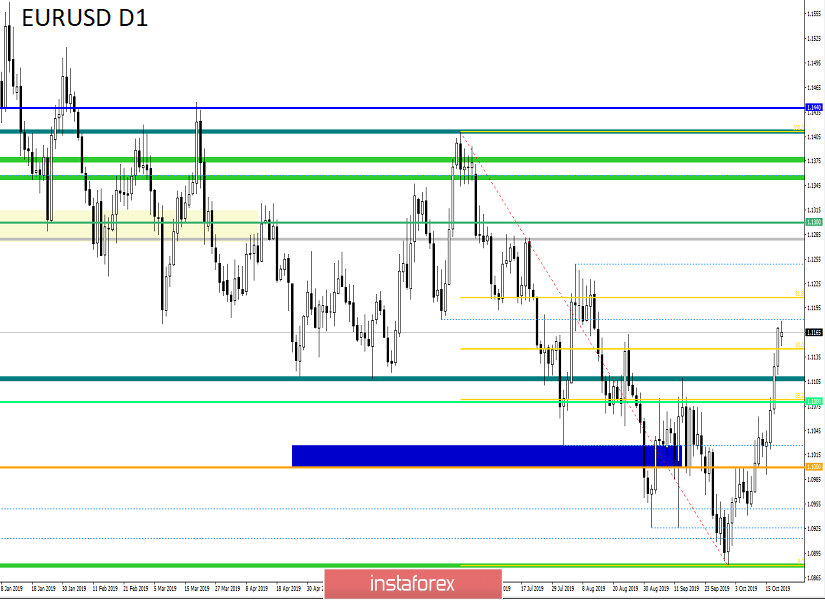
Looking at the trading chart in general terms (daily period), we see a vertical move, which is difficult to call even a correction. Thus, is it true that the status of the current movement is an oblong correction, and not just screwed on the emotions of the euro? There is no definite answer in this judgment, since each side, whether it is technical or emotional, has its facts and evidence, so you should wait a little longer to clear the main market tacts.
Friday's news background didn't have any statistical data for Europe and the United States, thereby once again leading its march to the information background, giving out a proportionally new part of the noise.
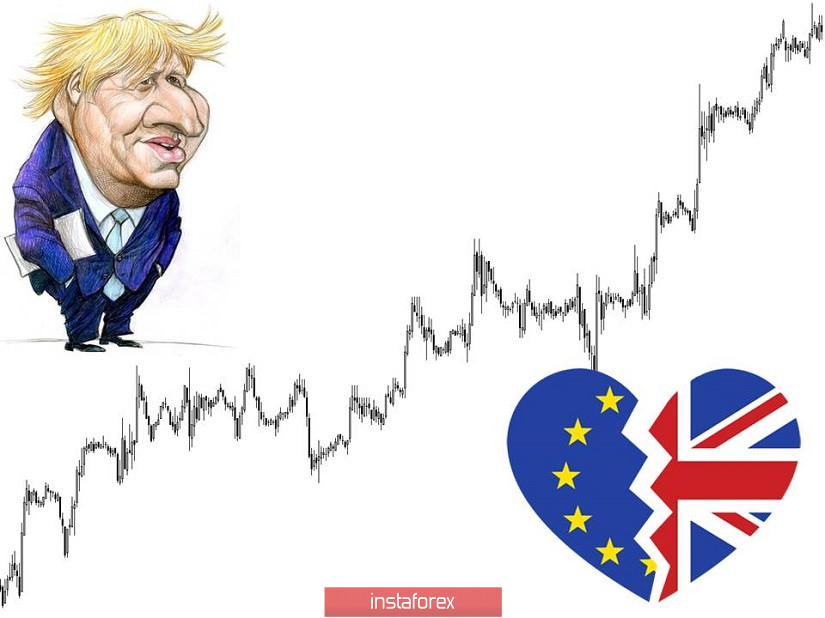
After the European Union agreed on a new version of the agreement, the turn went to the side of Britain, which on Saturday (October 19) held an emergency meeting in parliament, whereas a result it rejected the agreement for the fourth time in a row. This amazing, long-running series "Brexit" is striking in its scale and, most importantly, patience, as more than three years of going nowhere is worth a lot. So, this time we have another request to delay Brexit for 3 months, for which the British MPs voted for the majority. The absurdity of sending as many as three letters to the EU is striking, but we have already described this in more detail in the article on the pound. Now it's another matter, the EU, represented by the head of the European Council, Donald Tusk, has confirmed receipt of a letter requesting a postponement, and it seems that referring to diplomatic sources, the EU is ready to postpone Britain's exit from the EU if Boris Johnson fails to push through this week agreement through parliament.

Today, in terms of the economic calendar, we do not have data on Europe and the United States, which cannot be said about the background of Brexit. Today, the UK Parliament will re-introduce the Brexit agreement to the vote.
Further development
Analyzing the current trading chart, we see an attempt to resume the upward move after a small stop, where the maximum of the last week was already pierced by the quote, having a new value in the face of the mark of 1.1179. Detailing the hourly available day, we see that with the entry of Europeans, there was a surge in the market, but it was short-lived, and then again there was a slowdown. The burst period is 10:00 – 11:00 hours (trading terminal time).
In turn, speculators fixed previously open positions from 1.1130 with exit points of 1.1160 – 1.1180. A wait-and-see position is being made for the most optimal entry into the market.
It is likely to assume that in the case of a moderate information background, a temporary compression may occur within 1.1145/1.1180, where further work will be carried out relative to the specified framework by the method-boundary breakdown. At the same time, the tactics of monitoring the news feed and alternative sources of information (Twitter) are preserved when analyzing the behavior of the quote.
Based on the above information, we derive trading recommendations:
- We consider purchase positions in terms of clear price-fixing higher than 1.1180, preferably with an inertial stroke in the form of an impulse.
- Sell positions are considered in terms of a clear fixation of the price below 1.1140, with an inertial course in the form of momentum.
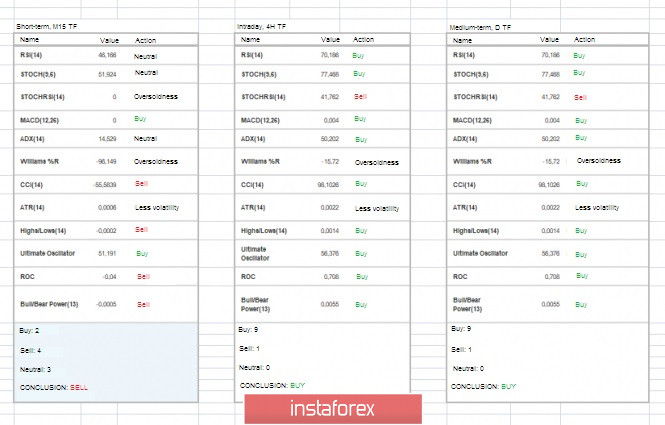
Indicator analysis
Analyzing different sectors of timeframes (TF), we see that the indicators, in general, signal a continuing upward trend due to a massive inertial movement. Indicators in the short term took a variable position in terms of downward interest due to temporary accumulation.
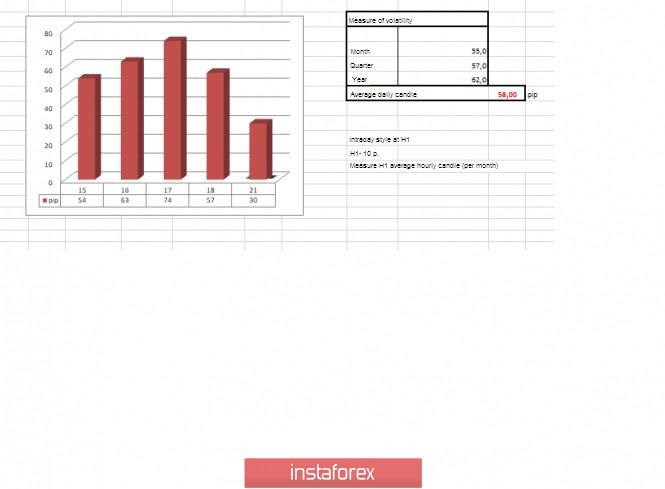
Volatility per week / Measurement of volatility: Month; Quarter; Year
Measurement of volatility reflects the average daily fluctuation, calculated for the Month / Quarter / Year.
(October 21 was built taking into account the time of publication of the article)
The volatility of the current time is 30 points, which is the average for this period. It is likely to assume that due to the information background, volatility may still increase, unless, of course, there is a characteristic slowdown.
Key levels
Resistance zones: 1.1180*; 1.1300**; 1.1450; 1.1550; 1.1650*; 1.1720**; 1.1850**; 1.2100.
Support zones: 1.1100**; 1.1000***; 1.0900/1.0950**; 1.0850**; 1.0500***; 1.0350**; 1.0000***.
* Periodic level
** Range level
*** Psychological level
**** The article is based on the principle of conducting transactions, with daily adjustments.