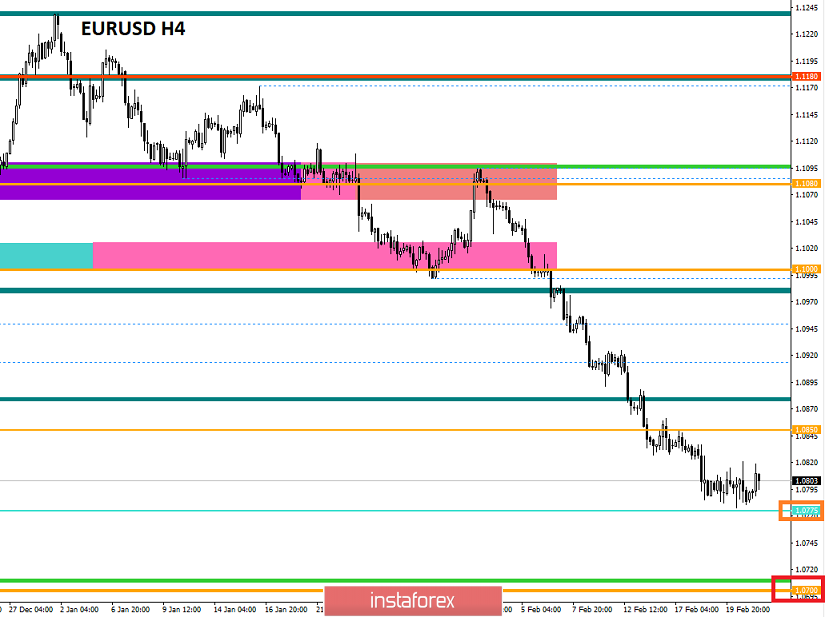
From a comprehensive analysis, we see a flat with variable boundaries of 1.0782/1.0820. Now, about the details. The downward movement that was set at the beginning of the year managed to lower the rate of the single currency by more than 440 points. Moreover, since the beginning of February, the movement has been inertial at all. Such vivid stability leads to overheating of short positions and the lack of proper corrections can disrupt that stability. The market is emerging from this difficult situation with the help of accumulations and variable flat, where a horizontal movement of 60 hours is currently observed, which is not a small fluctuation in terms of time weight.
Regarding the theory of downward development, we see a kind of synchronicity, where a fellow GBP/USD market has a similar development in itself with one exception - that it is just beginning the recovery process. While on the EURUSD pair, we are already storming the psychological ranges. It turns out that we have a positive correlation and there is a chance of an additional incentive when trading moves interact. Regarding the development of the euro/dollar pair, we are faced with a 50% range level 1.0700//1.0775//1.0850 and the existing flat was formed near it. The main focal point remains the level of 1.0700 and only its breakdown would give a further turn to the new psychological range. To better understand the psychological ranges, I advise you to analyze the period of 2015-2017.
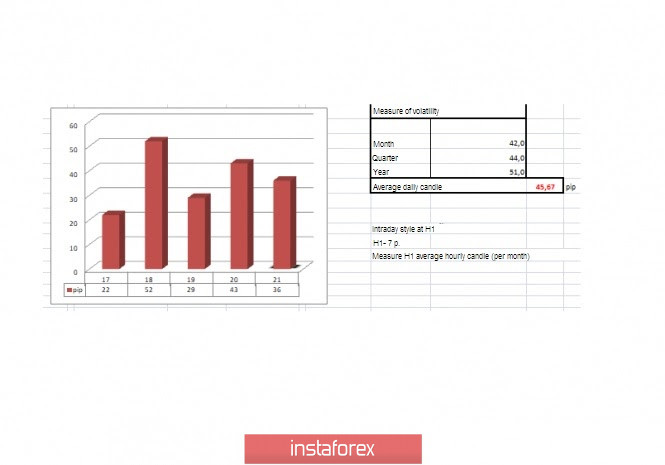
In terms of volatility, we see that the activity of the previous day increased by 48% compared to the day before, which we expected due to the regularity - a sharp slowdown (29 points) -> acceleration (43 points).
Analyzing the past day by the minute, we see a V-shaped formation (15:15-18:15 time on the trading terminal) inside the flat movement of 1.0782/1.0820. The subsequent fluctuation was in terms of price concentration near the lower end of the range.
As discussed in the previous review, the majority of traders are working on the downside, which corresponds to the general background of the market, as well as the characteristic FOMO syndrome (lost profit syndrome).
Looking at the trading chart in general terms (the daily period), we see a significant downward movement that develops in the area of April 2017. We have about 460 points left to the 17-year low, which does not seem such a long distance but the psychological pressure is enormous.
The news background of the previous day included data on applications for unemployment benefits in the United States, where the total increase was 25,000: Primary +4,000; Repeated +21,000.
The market reaction to the negative data on the US was in terms of a local weakening of the dollar, and then within the flat. The US currency has remained on the horseback, although the overheating of short positions is significant.
In terms of the general information background, we have the start of an emergency EU summit, where the burning issue of the seven-year EU budget was discussed. The first day ended with literally nothing, as everyone was faced with a disagreement – who and how much would contribute to the community treasury?
Members of the European Union can be understood since they lost a lot in the face of the United Kingdom, which gave more than 11 billion euros a year to the budget. And now, a hole in the seven-year budget is the size of a small country.
As we understand it, Germany is not ready to cover all costs and is trying to shift responsibility to all members of the community. Thus, there are conflicts of interest.
This is the end of the first day of the summit. Everything will continue on Friday but there will be no results.
Details: The budget for 2021-2027 assumes funding at the level of €1.087 trillion for the entire seven-year period at constant prices in 2018. The total payments of all countries to the EU budget for the final seven-year period 2014-2020 were planned at the level of €908.4 billion in constant prices in 2011.
Today, in terms of the economic calendar, we had data on inflation in Europe, where there was an increase from 1.3% to 1.4%. An hour before the publication of inflation data, preliminary PMI figures were released, which were slightly better than forecasts. There was an increase in the PMI data and inflation expectations, then a descent on the coincidences of the inflation expectations. In the second half of the day, similar PMI data will be released. However, in the United States, nothing positive is expected but if you refer to the fact that the dollar is now ignoring bad data, then there is a chance of holding positions.
The upcoming trading week in terms of the economic calendar is quite measured and the only day that may interest us is Thursday, where we are waiting for a package of statistics on the United States.
The most interesting events displayed below:
On Wednesday, February 26
USA 16:00 London time - new home sales (Jan): Prev -0.4% -> Forecast 1.5%
On Thursday, February 27
USA 14:30 London time - basic orders for durable goods
USA 14:30 London time - applications for unemployment benefits
USA 14:30 London time - preliminary GDP data: Prev. 2.1%
Further development
Analyzing the current trading chart, we see the movement in the same range as the day before. This is another signal that downward interest is now a priority. If market participants turn a blind eye to such a significant overheating of short positions, reflecting all this in a sideways course, then trading operations can be regrouped. I believe that the FOMO syndrome played an integral role here and it persists in the market, which may lead to a further descent towards the middle level (1.0775) and the main (1.0700).
Detailing the available period every minute, we see that the beginning of the European trading session was expressed as an upward movement due to the publication of statistical data. The subsequent oscillation was already in the plan of the reverse course, just at the moment of approaching the upper limit of the range.
In terms of the emotional mood of market participants, we see the high speculative interest that came with FOMO.
In turn, traders still consider the downward trend as the main prospect but it is worth considering that traders use the optimal risk for transactions. Thus, they are not afraid of a flat and technical correction.
It is likely to assume that the fluctuation within the flat 1.0782/1.0820 will persist, where you can build work on the method of breaking the frames with the entrance to the impulse candle.
If you are already trading for sale, then your path is directed towards the border of 1.0700 with a top-up below 1.0775. Local buy operations are considered in case of a technical correction. However, you need a reason and fix the price higher than 1.0820 with the output of a pulse candle.
Based on the above information, we will output trading recommendations:
- Buy positions will be considered if the price is fixed higher than 1.0820, with the prospect of a move to 1.0850, a local transaction.
- Positions for sale are already held by medium-term traders. Intraday traders are waiting for a break of the mark of 1.0775, with a characteristic impulse.
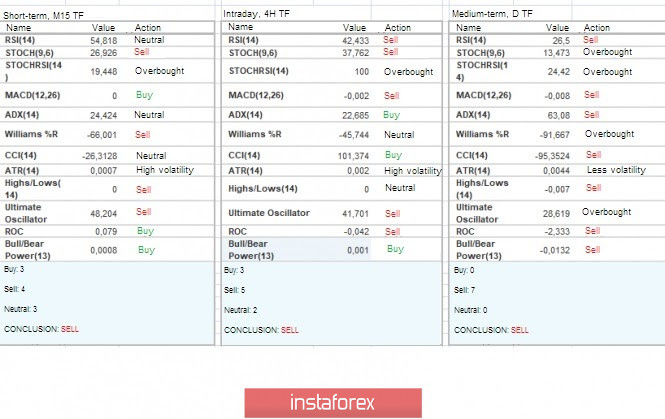
Indicator analysis
Analyzing different sectors of timeframes (TF), we see that the indicators of technical instruments signal a multidirectional slip.
Volatility for the week / Volatility Measurement: Month; Quarter; Year.
The volatility measurement reflects the average daily fluctuation from the calculation for the Month / Quarter / Year.
(February 21 was based on the time of publication of the article)
The volatility of the current time is 36 points, which is not bad in terms of dynamics for this period. It is likely to assume that volatility may still locally accelerate within the range but the main turn will come after the breakdown of the boundaries.
Key levels
Resistance zones: 1.0850**; 1.0850**; 1.0879*; 1.0900/1,0950**;1.1000***; 1.1080**; 1.1180; 1.1300**; 1.1450; 1.1550; 1.1650*; 1.1720**; 1.1850**; 1.2100.
Support zones: 1.0775*; 1.0700; 1.0500***; 1.0350**; 1.0000***.
* Periodic level
** Range level
*** Psychological level
***** The article is based on the principle of conducting a transaction, with daily adjustments.