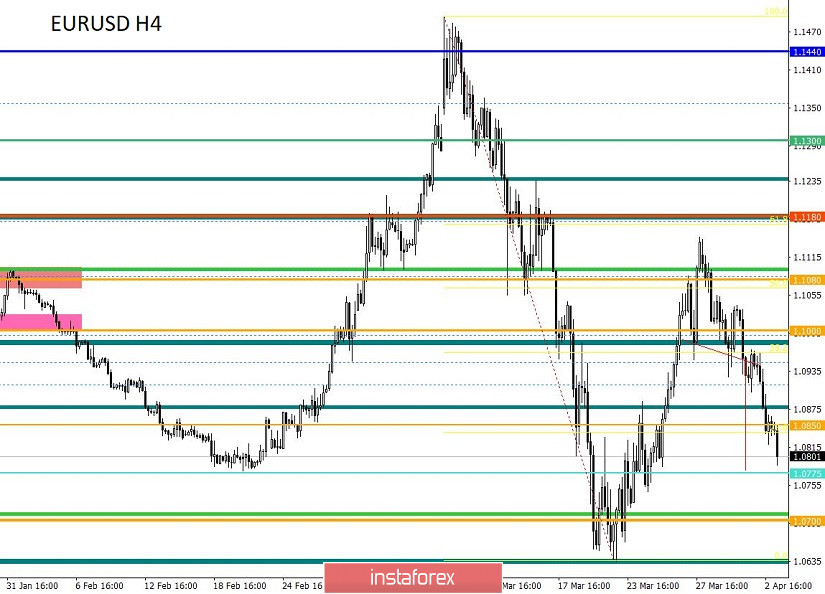
From the point of view of a comprehensive analysis, we see the strengthening of the US dollar almost throughout the trading week, and now let's talk about the details. The sequence of inertia is amazing. We have recorded V-shaped oscillations literally from the beginning of January of this year, where there are already four models in total, the scope of which is stably high. Regarding the current week, we see that the dollar against the euro regains its position despite the logic of the fundamental aspect, but in terms of technical analysis, just V-shaped models. The restoration of more than half relative to early inertia is the basis of the existing formation.
Considering the graphic model "Head and shoulders" [H1 graph], which was discussed in the review of April 1, we see that its execution has almost reached its end, which means that theories of local oscillations work.
Let me remind you that back in that week, we decided on the tactics of working on local movements, contrary to all trends, referring to the fact that the market is highly susceptible to the external background, and the panic on it forms movements of considerable proportions. This time we received confirmation of this tactic again, where the upward inertia of the past week, which, at first glance, was stable, also quickly changed its mood, as it arose on the market.
Regarding volatility, we see steadily high indicators that exceed the daily average. Market acceleration will exceed the two-month mark very soon. But now, we can safely say that the activity is many times higher than last year, and such stable stability in the form of acceleration has not been seen for a very long time. Against this background, speculators have intensified, who take this opportunity to take a solid profit from the market.
Details of volatility: Monday - 155 points; Tuesday - 183 points; Wednesday - 115 points; Thursday - 278 points; Friday - 166 points; Monday - 151 points; Tuesday - 234 points; Wednesday - 243 points; Thursday - 326 points; Friday - 194 points; Monday - 191 points; Tuesday - 160 points; Wednesday - 133 points; Thursday - 188 points; Friday - 194 points; Monday - 134 points; Tuesday - 127 points; Wednesday - 136 points; Thursday - 147 points. The average daily indicator, relative to the dynamics of volatility is 108 points [see table of volatility at the end of the article].
Analyzing the past day, we see that the main round of short positions declined again at the start of the European session and lasted until 18:00 UTC+00. Subsequent oscillations occurred in amplitude motion along the level of 1.0850.
As discussed in the previous review, traders considered the two coordinates of 1.0900 and 1.0970, regarding which they planned to start work.
The recommendation from Thursday regarding fixing prices lower than 1.0900 coincided, having a profit at the first forecasted value.
[We consider selling positions if prices are fixed lower than 1.0900, with the prospect of a movement to 1.0850 -1.0775.]
Considering the trading chart in general terms [the daily period], we see the very inertial fluctuations in the structures of V-shaped models, which we wrote about at the beginning of the article.
The news background of the past day contained data on producer prices in Europe, the pace of which, for the seventh month in a row, has been slowing down. This factor can play a further role in lowering inflation in the EU and, as a fact, put further pressure on the ECB, which will be forced to lower the refinancing rate. In the afternoon, market participants again faced a shock in terms of the labor market in the United States, where the number of applications for unemployment benefits repeated the story of the past week in the form of a multiple increase. So, the number of initial applications was 6,648,000, and repeated 3,029,000, and this is one of the most significant strikes since the Great Depression.
The reaction of the market to such strong statistics was across the entire logic of fundamental analysis, the US dollar continued to strengthen. What is the reason for this resonance? Experts are inclined to believe that investors are uncertain due to the strong external background, where, in view of the possible consequences of the COVID-17 virus in other countries, staying in dollars is most attractive.
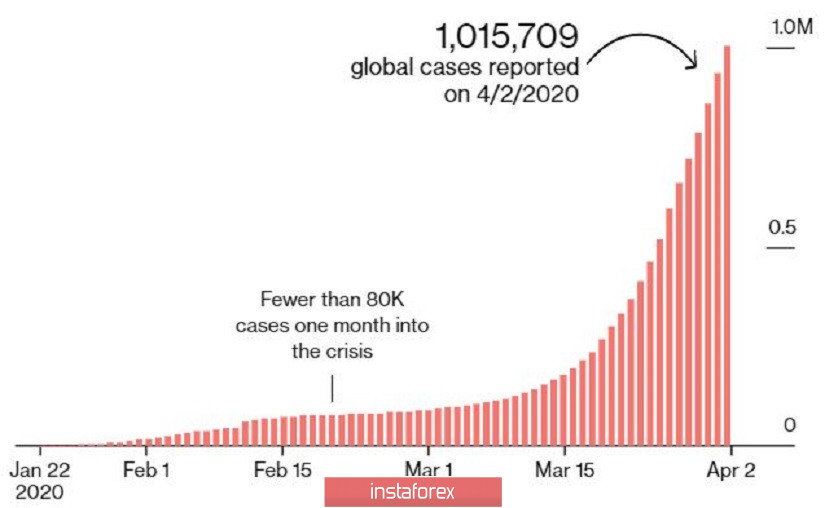
In terms of the general informational background, we see that in accordance with the epidemiological situation and the spread of COVID-19 in the world, more than one million cases of infection have already been recorded, of which fatal 53 166. The initial assessment that there are signs of improvement in Europe has not been confirmed, so how the virus from the epicenter [Italy] pumped to Spain, Germany, France, where the indicators are terrifying and the consequences of the pandemic will keep you waiting. So it turns out that investors who see such significant blows to the US labor market immediately look at other countries where the blows can be even more significant, and thereby choose less risk from the overall risk.

Today, in terms of the economic calendar, we have a key event of the week. A report by the United States Department of Labor, which already expects a recession of all that is, but it may turn out to be worse. From a preliminary estimate, unemployment is expected to increase from 3.5% to 4.0%, and the number of jobs outside agriculture can be reduced by 150 thousand.
From the point of view of the logical meaning of fundamental analysis, the report should put pressure on the US dollar, unless, of course, investors continue to remain in the dollar as a relative "safe haven" due to the general risk.
The upcoming trading week in terms of the economic calendar has a number of statistical indicators that are worth paying attention to, but the main impulse remains the external background, which puts enormous pressure on market participants.
The most interesting events displayed below --->
Tuesday April 7th
USA 14:00 Universal time - The number of open vacancies in the labor market JOLTS (Feb)
Wednesday, April 8
USA 18:00 Universal time - minutes of the meeting of the US Federal Open Market Committee
Thursday, April 9
USA 12:30 Universal time - Applications for unemployment benefits
Friday April 10
USA / EU / Britain - Good Friday
USA 12:30 Universal time - Inflation
Further development
Analyzing the current trading chart, we see that the compression of quotes during the Pacific and Asian trading sessions led to a splash of short positions, just at the start of the Europeans, which as a result, updated the lows of the week. In fact, we received confirmation once again that investors retain their dollar positions, but do not forget that our trading strategy should be built in terms of local positions, since now it is most attractive in the form of income. Thus, it is worth considering both positions at once now, the first one proceeds from the fact that the report of the United States Department of Labor will be even worse, where it is worth looking at the current fluctuation within a given time interval and trying to fly into a local upward move. While there is no report, we have a support level in the form of a value of 1.0775, where it makes sense to take a pause if we do not have positions.
In terms of the emotional background, we see an initial panic, where market participants are very much exposed to the external background, and, as we see in practice, even logical fundamental indicators react in the market in a completely different way.
Based on the above information, we derive trading recommendations:
- We consider buying positions in two versions, the first technical, that is, a rebound from the level of 1.0775, the entrance is higher than 1.0815, with the prospect of a move to 1.0850. The second method is already considered closer to the publication of the report of the United States Department of Labor, analyzing the slowdown for shorter periods.
- We consider selling positions already in the field of price fixing lower than 1.0775, with the prospect of a move to 1.0700-1.0650.
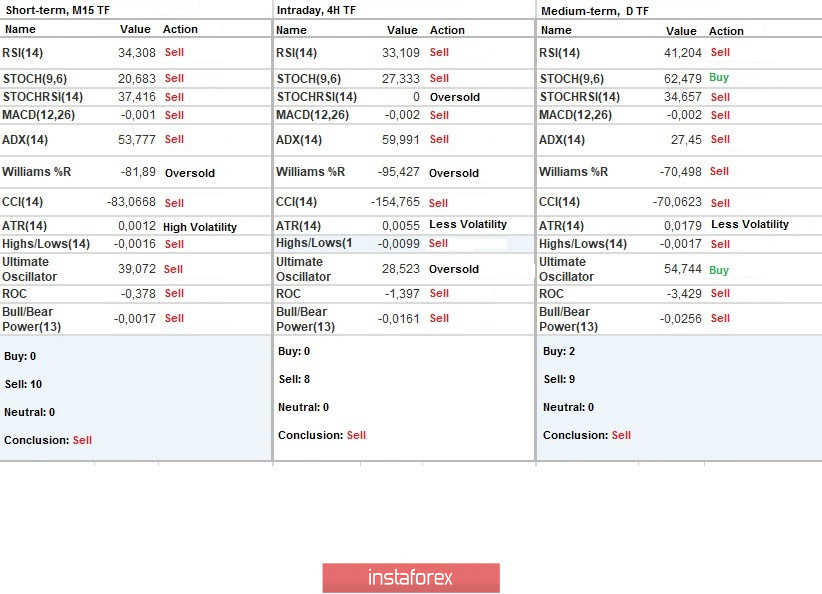
Indicator analysis
Analyzing a different sector of time frames (TF), we see that the indicators of technical instruments took the downward side relative to all the main periods due to the downward movement from the beginning of the trading week.
Volatility per week / Measurement of volatility: Month; Quarter; Year
Measurement of volatility reflects the average daily fluctuation calculated from Month / Quarter / Year.
(April 3 was built taking into account the time of publication of the article)
The volatility of the current time is 77 points, which is still considered a small indicator, but activity awaits us ahead. It can be assumed that the external background and the report of the United States Department of Labor will be an incentive to further accelerate volatility.
Key levels
Resistance zones: 1.0850 **; 1.1000 ***; 1.1080 **; 1,1180; 1.1300; 1.1440; 1.1550; 1.1650 *; 1.1720 **; 1.1850 **; 1,2100
Support Areas: 1.0775 *; 1.0650 (1.0636); 1.0500 ***; 1.0350 **; 1.0000 ***.
* Periodic level
** Range Level
*** Psychological level