To open long positions on EURUSD, you need:
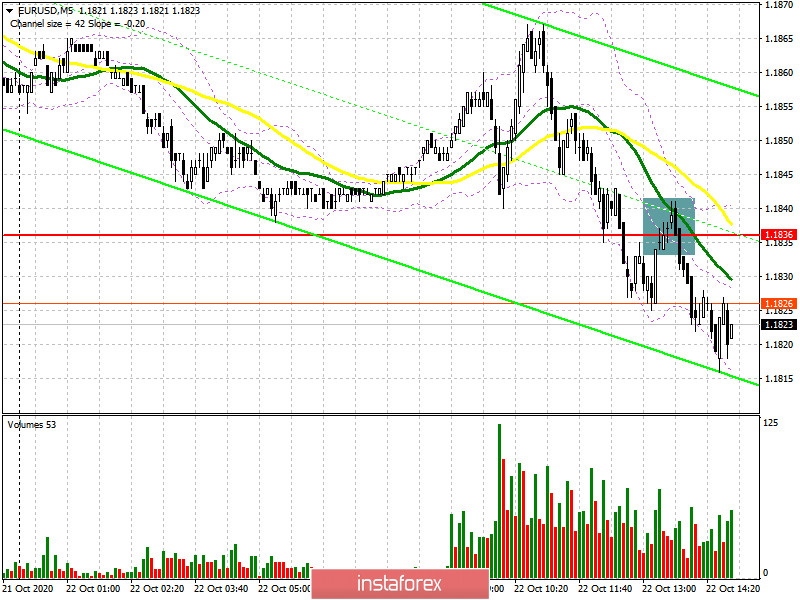
In my morning forecast, I paid attention to sales from the level of 1.1875, however, we did not reach it. However, if you look at the 5-minute chart, you will see that the bears managed to break below the support of 1.1836, and even gained a foothold under this level, which led to the formation of a signal to sell the European currency. Additional pressure on the euro was exerted by a weak report on German consumer confidence, which continued to decline amid the coronavirus pandemic.

The primary task of buyers for the second half of the day is to regain control over the resistance of 1.1836. Fixing at this level and testing it from top to bottom forms a good signal to open long positions in the expectation of continuing the upward trend observed throughout this week. The goal of the bulls in this scenario will be to return to the maximum of 1.1875, where I recommend fixing the profit. But even if the decline in the euro continues, it is too early to panic, since all this is a downward correction, and the next major level at which buyers will show themselves will be the area of 1.1802, from which I recommend opening long positions immediately for a rebound in the expectation of a correction of 15-20 points within the day.
To open short positions on EURUSD, you need:
Sellers coped with the morning task and regained control over the support of 1.1836, which now acts as a resistance. As long as trading is conducted below this range, you can expect a further decline in the euro, as the bullish momentum continues its gradual completion. If the pair grows in the second half of the day, the next formation of a false breakout at 1.1836 will be a signal to open short positions in order to return EUR/USD to the support of 1.1802, where I recommend fixing the profits. The longer-term target will be at least 1.1765. In the scenario of EUR/USD growth above 1.1836 and lack of activity among sellers at this level, it is best not to rush to open short positions, but to wait for the update of the maximum of 1.1875 and sell the euro there for a rebound for a correction of 15-20 points.
Let me remind you that the COT report (Commitment of Traders) for October 13 recorded a reduction in long positions and an increase in short ones, which led to an even greater decrease in the delta. But despite this, buyers of risky assets believe in the continuation of the bull market, but prefer to proceed cautiously, as there is no good news on the Eurozone yet. So, long non-commercial positions declined from a level of 369,231 to 228,295, while non-commercial short positions increased from the level of 57,061 to the level of 59,658. The total non-commercial net position fell to 168,637, compared to 174,308 a week earlier, which indicates a wait-and-see attitude of new players. However, bullish sentiment for the euro remains quite high in the medium term. The stronger the euro declines against the US dollar at the end of this year, the more attractive it will be for new investors.
Signals of indicators:
Moving averages
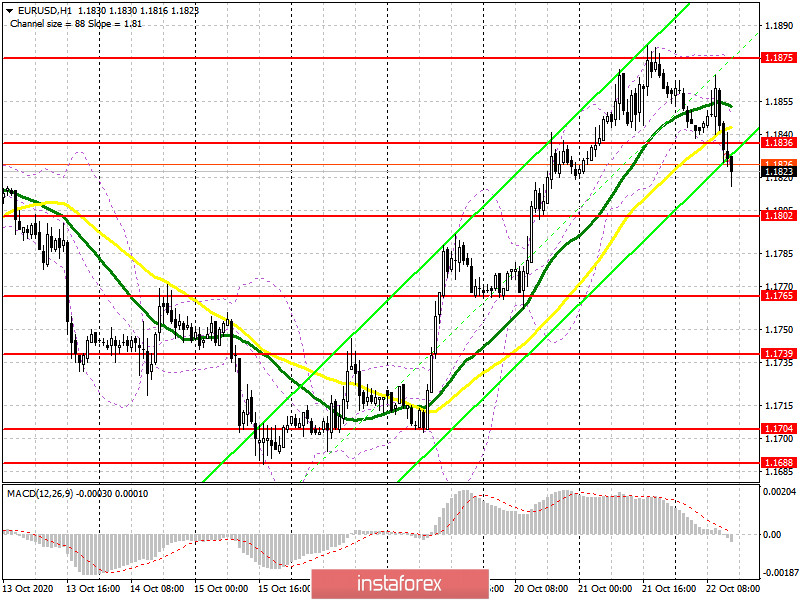
Trading is conducted below 30 and 50 daily moving averages, which indicates the formation of a downward correction in the market.
Note: The period and prices of moving averages are considered by the author on the hourly chart H1 and differ from the general definition of classic daily moving averages on the daily chart D1.
Bollinger Bands
If the pair grows, the average border of the indicator around 1.1850 will act as a resistance, and you can sell the euro immediately on a rebound from the upper border of the indicator in the area of 1.1875.
Description of indicators
- Moving average (moving average determines the current trend by smoothing out volatility and noise). Period 50. The graph is marked in yellow.
- Moving average (moving average determines the current trend by smoothing out volatility and noise). Period 30. The graph is marked in green.
- MACD indicator (Moving Average Convergence / Divergence - moving average convergence / divergence) Fast EMA period 12. Slow EMA period 26. SMA period 9
- Bollinger Bands (Bollinger Bands). Period 20
- Non-profit speculative traders, such as individual traders, hedge funds, and large institutions that use the futures market for speculative purposes and meet certain requirements.
- Long non-commercial positions represent the total long open position of non-commercial traders.
- Short non-commercial positions represent the total short open position of non-commercial traders.
- Total non-commercial net position is the difference between the short and long positions of non-commercial traders.