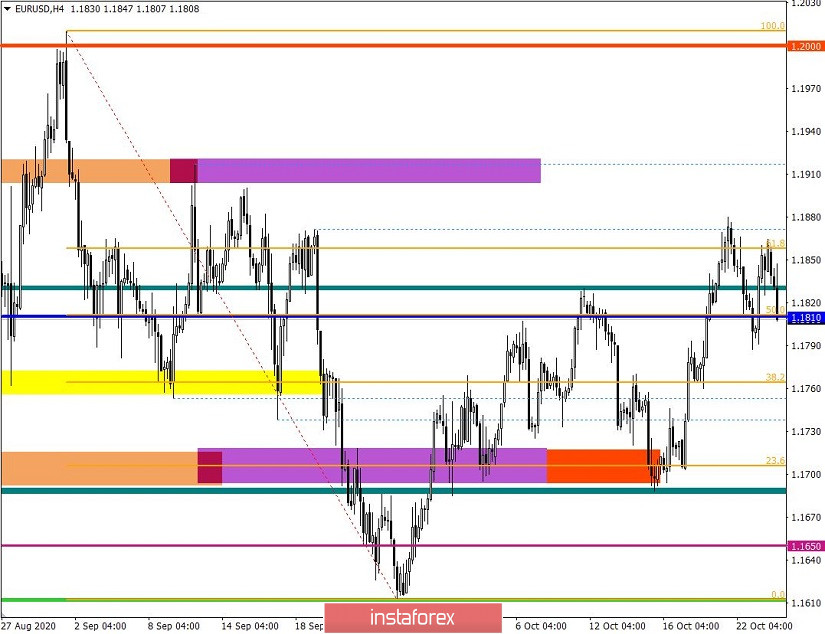
The EUR/USD pair updated the local high of the correctional course last week. As a result, the coordinates of 1.1880 were reached. In connection with which, there was a flow of short positions, which returned us to the level of 1.1790.
There was an attempt to restore the downward interest, but the market participants failed to stay below the level of 1.1790. This led to another round of long positions, which concentrated us within the high of the corrective move.
Looking at the clock components of the market in detail, you can see that the quote is located in the side channel 1.1700/1.1900, which appeared on the market during the summer season. Such a long-term price focus on a certain area indicates a high degree of uncertainty, but over time, this will lead to a trend where the technical signal will be a breakout of one of the key coordinates 1.1612 or 1.2010.
Analyzing last Friday's fifteen-minute, a surge in long positions was observed during the start of the European session and lasted until the beginning of the American session. After that, against the background of US statistics, there was a local decline of about 30 points, but buyers eventually closed the week in their favor.
In terms of Friday's daily dynamics, 80 points were recorded, which is 6% higher than the average. The speculative excitement can be clearly seen, where the major share of the volatility occurred during the European session.
Looking at the trading chart in general terms (daily period), you can see the recovery process relative to the decline in September, but everything can still change as the continuation of the downward trend.
Friday's news background had preliminary data on business activity in Europe, where we expected a decline in the indices, but instead we saw a partial increase in them, which contributed to the strengthening of the European currency.
Manufacturing PMI: Prev. 53.7 --->54.4
Services PMI: Prev. 48.0 ---> 46.2
They will publish a similar indicator in the US during the afternoon, where they expected that the indices to be the same, but it reflected growth instead, which affected the strengthening of the US dollar at the time of the publication of statistics.
Services PMI: Prev. 54.6 ---> Forecast 56.0
Manufacturing PMI: Prev. 53.2 ---> Forecast 53.3
In terms of information flow, we have negotiations between England and Brussels on trade relations after Brexit, where, according to the main negotiators, the parties are ready to make concessions to each other. Against this background, EU representative Michel Barnier decided to extend the negotiations until October 28.
It is difficult to say that the negotiations was successful, but what we know for sure is that there is no more time and the additional period allocated for negotiations will end in just two weeks.
In terms of the economic calendar, we only have US data on new home sales today, which is expected to grow by 3.5%. The indicator is published during the closing of the European session, but the data are not so important for the market.
Further development
Analyzing the current trading chart, you can see that a downward gap arose with the market opening, which indicated the direction of trading interest. As a result, the quote returned to the level of 1.1810, while maintaining a sharp decline.
We can assume that the target of the quote is Friday's local low (1.1790), where the next movement in the market will be clear depending on how market participants behave within it.
Based on the above information, we will display trading recommendations:
- Consider buy deals as a price rebound from the area of 1.1790/1.1810 in the direction of 1.1860.
- Consider sell deals after the price consolidates below 1.1785, with the prospect of moving to 1.1700.
Indicator analysis
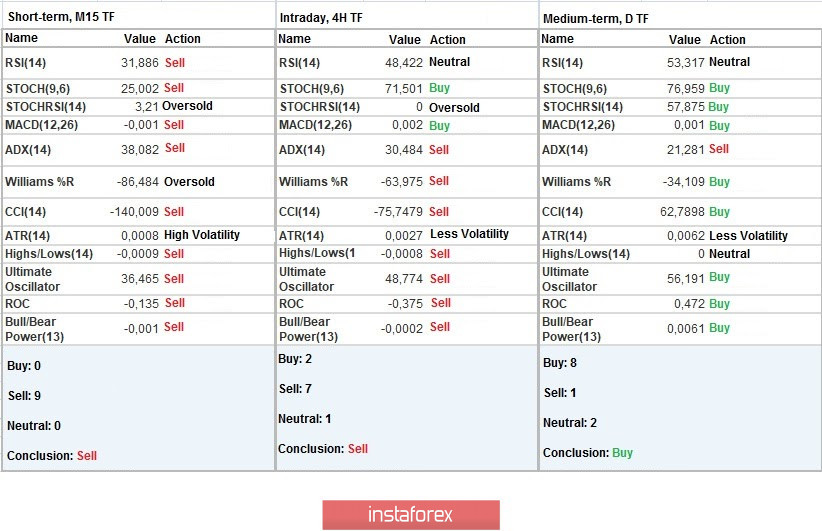
Analyzing different sectors of time frames (TF), it can be seen that the technical indicators on minute and hourly TFs have a sell signal due to a current decline. The daily TF, in turn, still has a buy signal, due to finding the quote at the peak of the correction.
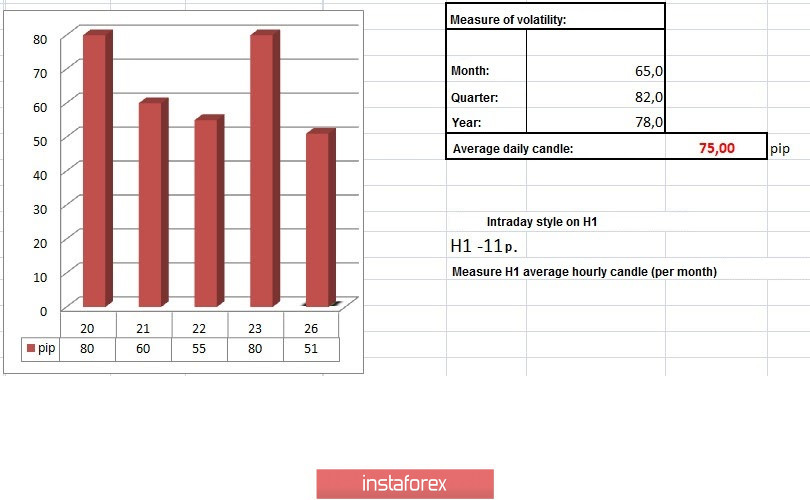
Weekly volatility / Volatility measurement: Month; Quarter; Year
Measurement of volatility reflects the average daily fluctuation, calculated per Month / Quarter / Year.
The volatility of the current time is 51 pips, which is even 32% below the average. If the quotes are kept below 1.1790, an increase in the market activity may follow.
Key levels
Resistance zones: 1.1810; 1.1910; 1.2000 ***; 1.2100 *; 1.2450 **; 1.2550; 1.2825.
Support zones: 1.1810; 1.1700; 1.1650 *; 1,1500; 1.1350; 1.1250 *; 1.1180 **; 1.1080; 1.1000 ***.
* Periodic level
** Range level
*** Psychological level