After Fed Chairman Jerome Powell announced that the Open Market Committee did not expect a mitigation cycle, and the rate reduction was a one-time action, US stock indices began to decline actively. This supported precious metals, despite the rise in the dollar, updating its two-year maximum, which soon lost its fighting spirit, and ultimately can be qualified as a false breakdown. However, the dollar will not be discussed in this article, but gold. Therefore, let us consider the fundamental factors affecting the price, for which we use the data of the World Gold Council - World Gold Council and the US Commodity Futures Commission - CFTC.
According to the World Gold Council, total demand for gold amounted to 1,123 tons in the second quarter of 2019, which is 8% higher than last year. At the same time, in the first half of the year, demand for gold jumped to a three-year high and amounted to 2182 tons, which was mainly due to record purchases of central banks and ETF trading funds, and is especially important from the point of view of price growth potential. Also, in the second quarter, assets secured by gold ETF increased by 67.2 tons, to a six-year high, and amounted to 2548 tons. The main factors affecting the growth of purchases were persistent geopolitical instability. The expectation of lower interest rates of the US Federal Reserve and the rise in gold June has reached multi-year highs.

Moreover, the price of gold received support from the Indian jewelry market, which survived the recovery. However, investments in bars and coins decreased by 12% to 218.6 tons in the second quarter. In turn, the decline in the Australian dollar led to an increase in production profitability in one of the most important regions, which led to an increase in supply by 6%.
Despite the fact that the demand for jewelry is about half of the total consumption, in my opinion, the most important factors affecting the price of gold is the demand from the North American exchange trading funds, they are also ETF, as well as the positioning of traders on the COMEX-CME exchange. It was the purchases of exchange-traded funds from the United States and Europe that contributed to the increase in prices in June. Yet, in July, the gold quotes went into the range. At the moment, we have no data on purchases made by ETF in July since they will appear a little later, but we have data from the commission on US commodity futures - CFTC, on the positions of traders on the stock exchange (Fig. 1). This data is the most timely source of fundamental information about market positioning.
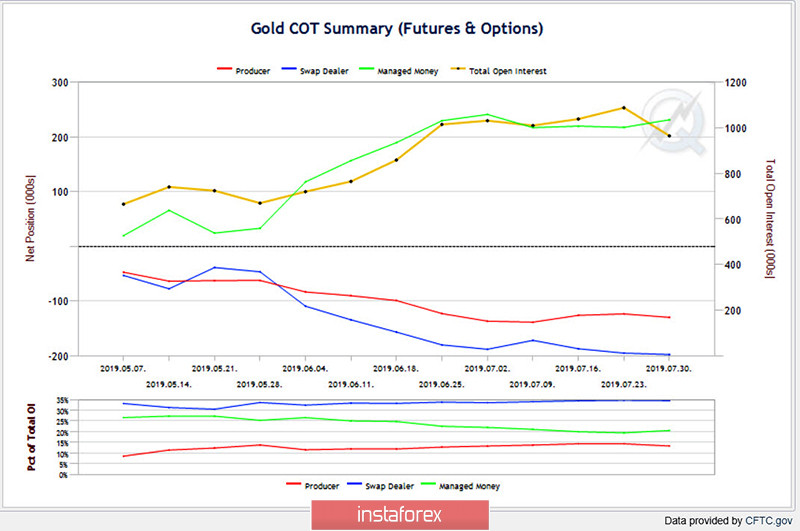
Let's consider the Disaggregated COT Report report submitted by traders to the US Commodity Futures Commission. As follows from the report, Open Interest of traders for the previous reporting week decreased by 11%, to 965 thousand contracts. This is not a very good signal for price growth, but the decline could have been due to a rise in the US dollar exchange rate at the beginning of last week, which is reflected in the report and is published on Friday as Tuesday - Tuesday. However, for us, which category of traders left the market is the most important?
The answer to this question is given by diagrams of long and short positions of participants in this market. The CFTC classifies traders according to their functions, which allows us to understand who the main seller is and who is the buyer, and based on this, build a forecast for future price movements. Speculators (Money Manager) are a priori buyers, while operators (Producer) are sellers. The increase in volatility attracts not only speculators to the market, but also operators who insure their risks. Another category Swap Dealer takes a position on the situation, although it is counted among the CFTC sellers.
Figure 1: Visualization of the report on the obligations of traders
Following from the COT report, only one category of traders, the so-called Producer or operators insuring their cash gold positions, left the market. Reducing the short positions of the Producer group may ultimately lead to a general decline in prices, such as, for example, in 2017 and 2018. But then, they did not have so many unusual long positions. Now, their long positions have been at their highs since 2014. Therefore, we can assume that there was a fixation on the threshold of the Fed meeting. Moreover, the price of gold was in the range before this three weeks, which resulted in a decrease in volatility, and the need for insurance from them disappeared.
In my opinion, the most important role for the rise in the price of gold is played by Money Manager positions - speculators, who are, by definition, buyers earning on the movement of quotes. Price can not rise if buyers do not buy gold. As can be seen from the diagram, the long positions of the speculators again approached their highs, which indicates the upward trend vision of this category of bidders.
At the moment, the December contract is the most liquid, with a price of $ 1,452, which is $12 higher than in the cash market. Thus, looking at the positions of speculative traders on the COMEX-CME exchange, we can assume that they are counting on a further increase in the price of gold.
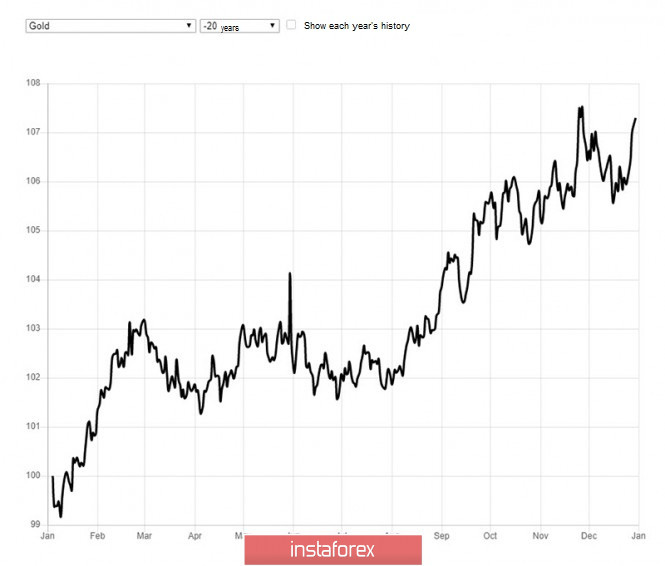
In addition to analyzing trader positions, we will look at the seasonality of the market over the previous 20 years (Fig. 2). As follows from the chart of seasonality of gold, in the period August-September, the price on average increased seasonally. There were exceptions to this rule when the price was in the range and even decreased, but the weighted average curve shows a total increase. A similar picture is observed in the 10-year period of time. At the same time, over a period of 5 years in August-September, the price of gold was in the range, but the previous five years cannot be called successful for gold, which was depressed due to the policies of central banks and general financial regulation.
Fig.2: Seasonal price chart of gold
Now, the gold paradigm is changing before our eyes - central banks are actively buying an alternative to the US dollar, and gold itself seems to be losing its correlation with the dollar again. Since August 2018, gold has increased in price by 20% against the dollar, while the dollar itself has grown by 4% against a basket of foreign currencies. Earlier, gold was close to the US dollar for about two years, while the negative correlation reached -0.95.
Summing up my reasoning, I would like to note the following: from a fundamental point of view,, traders can expect a rise in the price of gold in August-September. However, when making decisions to buy, they should be guided by the price chart at InstaForex terminals and signals from their own trading system. No one knows the future, thus, we should be careful.