Over the last trading day, the EUR/USD currency pair showed high volatility of 63 points, as a result of which the quotation reached a milestone in the market. From the point of view of technical analysis, we see that the upward move is stable in the market, with more than 200 points of the rebound from the low (1.0879) of the current year. In fact, the price movement that we are observing – is a small reflection of the dynamics of the GBPUSD currency pair, where the amplitude of jumps for the same period exceeded several times. Thus, we have not just some emotional behavior of market participants, but the correlation between the GBPUSD and EURUSD currency pairs.
Analyzing the hourly past day, we see that the accumulation within the coordinate of 1.1030 has gone into existence, the boundaries have fallen, as well as the peak on October 11 (1.1062). The emotional and informational background fell on the period from 15:00-19:00 (time on the trading terminal0, where the impulse move of the price was recorded.
As discussed in the previous review, after the speculators still managed to work at the recovery stage, everyone decided to take a break, since jumping into a relatively narrow accumulation along the mark of 1.1030 did not make much sense. In this case, work was carried out regarding the breakdown of the values: 1.0990 (sell) and 1.1065 (buy), which was a pretty sure step in terms of trading. As a result – a successful entry into the market and an already profitable trading position.
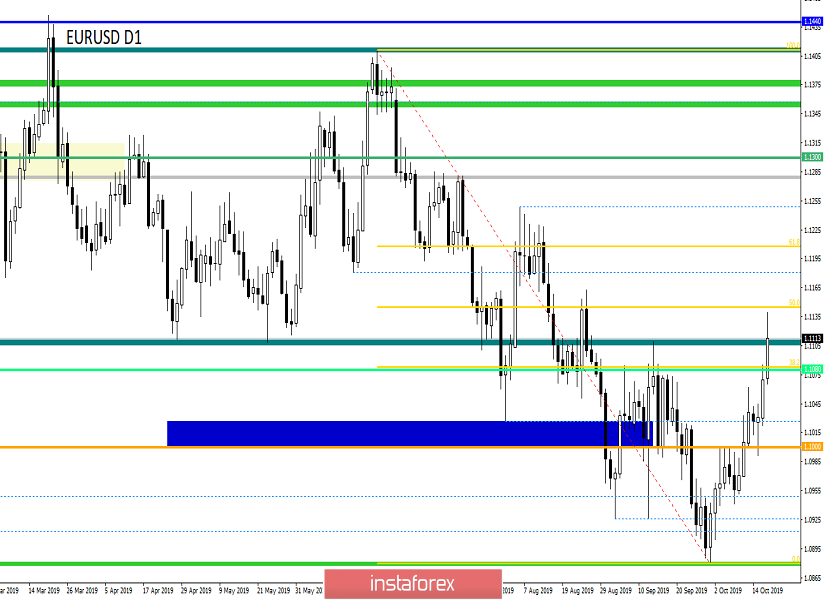
Considering the trading chart in general terms (daily period), we see that the quote is on the edge of the phase change, that is, if the price is fixed higher than 1.1110, the current correction will be transformed into an oblong (correction) and the process will be delayed for an indefinite period. There is another theory that we develop for the pound/dollar pair. If we assume that the past impulse jumps (October 10-17) are the emotions of the crowd against the background of the information flow, then in case of mismatch of expectations, a reverse reaction can occur and an oblong correction, as a fact, will be false.
The news background of the last day had data on inflation in the eurozone, where it turned out that the slowdown was not from 1.0% to 0.9%, but to 0.8%, which signals clear problems that can result in the actions of the regulator (ECB) in terms of reducing the interest rate in the negative zone. The statistics from the West were not encouraging either, retail sales in the USA are reduced from 4.4% to 4.1%. The reaction of the EURUSD currency pair to statistical data was practically absent since the main incentive for fluctuations is a strong information background.
So what pleased us with the information flow? More diverse statements by dignitaries. The head of the European Council, Donald Tusk, said that in the coming hours, everything will become clear where on Thursday he will receive the text of the draft and provide it for familiarization to members of the EU. He also suggested that it is likely on Thursday to accept this agreement to avoid chaos.
In turn, Emmanuel Macron and Angela Merkel responded quite positively to the work process, observing with progress and hoping for an early conclusion of the agreement.
Today, in terms of the economic calendar, we have data on the construction sector in the United States, where the indicators tend to decline. The volume of construction of new homes is reduced from 1.364M to 1.320M, and the number of building permits issued falls from 1.425M to 1.340M. The main event of the day is the start of the two-day summit of the European Council, where the burning issue of Brexit will be resolved. At the moment, the news is already coming, the head of the European Commission Jean-Claude Juncker said he was ready to recommend an additional protocol to the agreement at the EU summit.
"This is a fair and balanced agreement for the EU and the UK and it shows our commitment to finding solutions. I recommend #EUCO approves this deal," Jean-Claude Juncker wrote on Twitter @JunckerEU (10:34 London time)
Further development
Analyzing the current trading chart, we see a sharp surge in quotes just against the background of the statement of the head of the European Commission, locally throwing up the quote to the value of 1.1139. If you think this is the end of the race, no, this is only the beginning, as the summit is only in full swing and statements from both the EU and Britain are possible, which will give the market even more volatility.
The minute-by-minute detail of the trading chart confirms the market reaction to Juncker's tweet.
In turn, speculators, frankly speaking, in the "chocolate", yesterday opened trading positions to buy from 1.1065 and topping up from 1.1090 give so much significant profit that you can safely partially fix or close trading positions.
It is likely to assume that such price spikes will still persist in the market, thus monitoring the behavior of quotes and news years, I would also advise you to look closely at the tweets of Donald Tusk, Michel Barnier and Jean-Claude Juncker for possible information. From the point of view of technical analysis, the tactics of work in terms of jumping into the beginning of the pulse with a local presence in it.
Based on the above information, we derive trading recommendations:
- Buy positions are already available to many traders. The task now is to partially exit or leave the deal, with a further restart.
- We consider selling positions in terms of technical kickbacks.
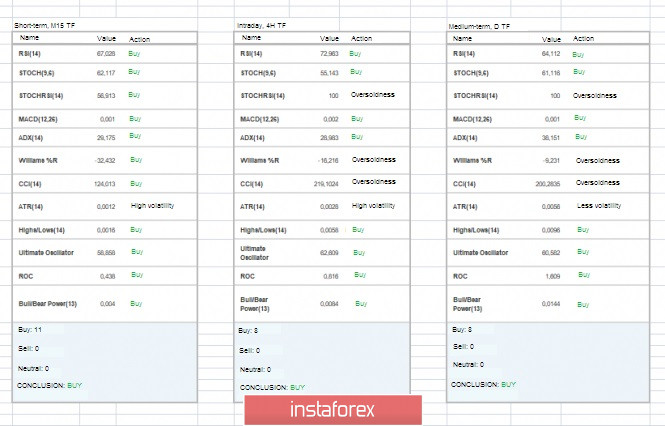
Indicator analysis
Analyzing different sector timeframes (TF), we see that the indicators on all major time intervals signal an upward trend. In fact, we see a strong influence of the information background, where the indicator analysis falls into a false track, which can harm the work.
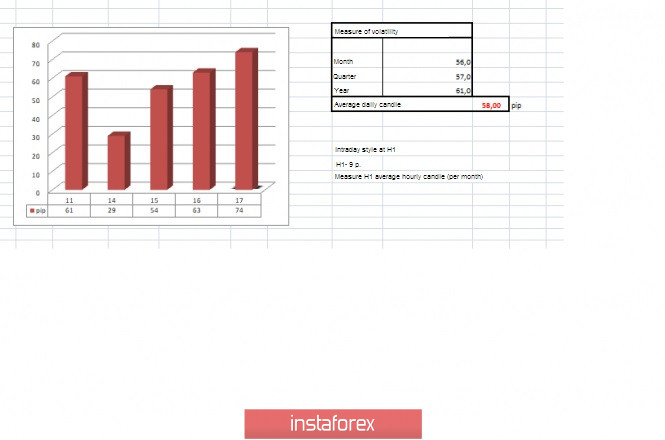
Volatility per week / Measurement of volatility: Month; Quarter; Year
Measurement of volatility reflects the average daily fluctuation, calculated for the Month / Quarter / Year.
(October 17 was built taking into account the time of publication of the article)
The volatility of the current time is 74 points, which already exceeds the average daily indicator by 27%. It is likely to assume that although volatility is already high, due to a strong information background, it can still grow.
Key levels
Resistance zones: 1.1180* ; 1.1300**; 1.1450; 1,1550; 1.1650*; 1.1720**; 1.1850**; 1.2100.
Support zones: 1.1100**; 1.1000***; 1.0900/1.0950**;1.0850**; 1.0500***; 1.0350**; 1.0000***.
* Periodic level
** Range level
*** Psychological level
**** The article is based on the principle of conducting transactions, with daily adjustments.