The pound/dollar currency pair took a market pause after the recent rally, hovering near the mirror level. What are the next steps – a wide flat will continue its development or we will again be waiting for the confirmation of the lower limit – we will answer these questions in our article.
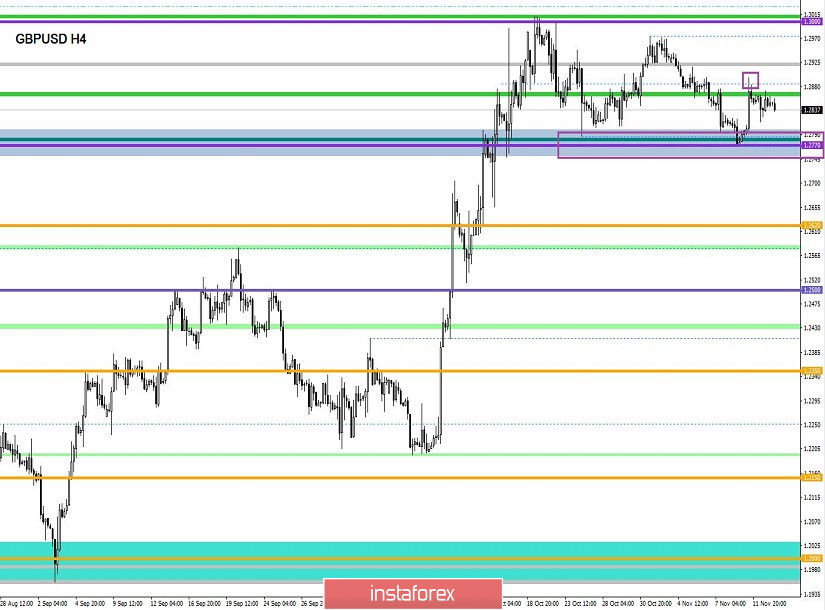
From technical analysis, we see the formation of a characteristic V-shaped amplitude, where the mirror level of 1.2885, obtained in the course of calculations from the range of 1.2770/1.3000, continues to hang over the quote. What we have is a persistent oscillation between the two target levels (1.2770/1.3000), with a sequential elaboration of conditionally each border. With respect to the current oscillation, we can say that the range of 1.2770 (1.2750/1.2770/1.2800) still played a role in the market, restraining the pressure of sellers, but the subsequent momentum after the fulcrum (November 11) managed to locally overheat long positions, and together with the mirror level of 1.2885, we saw another stop. At this stage, the question arises: do we have a move towards the next border in the face of the level of 1.3000? The question is interesting, because if on November 11 there was no characteristic information background, then the movement in terms of working out, perhaps, was not on such a scale. What I'm getting at is that the current stagnation may reflect a kind of indecision of market participants to further upward movement. Just look at the volatility of the last thirteen trading days and we will see an interesting picture: 58 – 65 – 97 – 62 – 75 – 45 – 67 – 58 – 53 – 83 – 53 – 118 – 58 points. That is, for 11 consecutive days, there was an extremely low, in some sense, indecisive indicator in the market, followed by a surge on November 11 (118 points) and again indecisiveness of 58 points. At the same time, if we analyze the fellow for the euro/dollar market, which, incidentally, also had a kind of side-channel (from October 16 to November 5), at this time it is no longer there, it was broken just at the time of the course of the past week, when the pound moved down. Thus, the working out of the level of 1.2770 on the GBPUSD pair may not be working out, but some local jump. It is worth considering that the above is one of the theories of the development of quotes within 1.2770/1.3000.
Analyzing the hourly past day, we see just the structure of the V-shaped oscillation, where the first stage was built on the morning impulse candles 09:00-11:00 (time on the trading terminal). After that, there was a restored process, which was smoother than step #1 and lasted until the end of the trading day.
As discussed in the previous review, traders recorded profits from local long positions at the time of price convergence with the mirror level of 1.2885. The next step was in terms of waiting, where at the time of descent to the area of 1.2840-1.2830 were laid next short positions, but with softer money management, due to the risk of support.
Looking at the trading chart in general terms (daily period), we do not see all the same fluctuation inside the levels of 1.2770/1.3000. Some traders, referring to the high period (TF), nicknamed this swing as a possible graphical figure "flag", but this is just one of the theories, as there are many "buts" that should be considered.
The news background of the past day had a large package of statistics in the UK. So, looking at the data on the labor market, we see that the average level of wages, including bonuses, is reduced from 3.7% to 3.6%, as well as excluding bonuses from 3.8% to 3.6%. In turn, applications for unemployment benefits rose sharply from 13.5 thousand to 33.0 thousand. The only positive news was the unemployment rate, which fell to 3.8%.
The market reaction to the statistics was mixed. So, before the publication, there was a clear fear of the worst, but after entering the statistical data, where the worst was confirmed, the light at the end of the tunnel displayed the unemployment rate, which helped to expand the quote for a while. By the way, here we have our V-shaped oscillation.
The information background continues to develop in the same framework of the divorce process and the election race. So, Chancellor Angela Merkel during the conference of German employers in Berlin said that the existing agreement has a high chance of getting approval in Britain.
According to the Chancellor, such a successful agreement was worked out because it was clear what the United Kingdom wanted.
Merkel's speech, of course, is loud, but if everything is so good, so why this miracle deal has not yet been approved – the answer, I think, you know.
In turn, in the pursuit of the vote, the Laborites were attacked by hackers. So, the Internet resources of the Labor Party were hacked, where the attackers intended to take the party's resources offline.
"As far as we know, they failed to steal our information, the attack was stopped thanks to an effective security system developed by our forces. But it shows what awaits us in the run-up to the elections. This worries me very much because a cyber attack on a political party taking part in the election raises serious suspicions," Labor leader Jeremy Corbyn said.
Today, in terms of the economic calendar, we have inflation data in Britain, where they expect a decline from 1.7% to 1.6%. In the afternoon, inflation data will be released in the United States, where it is projected to remain at 1.7%. It is worth considering such a moment that there is information that the inflation rate in the United States may not be confirmed, and we will still see a decline, thus it is worth being prepared for this, as the dollar may be under pressure locally.
Further development
Analyzing the current trading chart, we see the same oscillation, where the quote fluctuates in the phase of a certain accumulation of 1.2830/1.2865. The quote took a waiting position, as well as market participants, where the conditional ceiling in the form of a mirror level of 1.2885 is still preserved, and there is no courage to return to the fulcrum. Thus, a kind of chatter characterizes market interest, and it is worthwhile to carefully analyze the behavior of quotes and fixation points concerning variable values.
In terms of volatility, we have an extreme weakness, were in the period of the Pacific and Asian trading sessions, we had a literal consolidation. With Europeans entering the market, activity has risen, but not enough.
By detailing the per-minute movement, we see consolidation with the frames 1.2840/1.2860, where the quote is trying hard to overcome the lower limit.
In turn, some traders yesterday went into short positions in the area of 1.2840-1.2830, having at the moment about zero as of the transaction. Since traders have moderate positions with moderate money management. Alternative positions are considered.
Having a general picture of actions, it is possible to assume that the fluctuation within the existing accumulation will last very long, and perhaps today there will be a characteristic exit from it. If the rumors about the decline in inflation in the States are not confirmed, the dollar can get support and previously opened short positions will go into a plus. The conditional coordinates are now looking at the values of 1.2815 (sell) and 1.2885 (buy).
Based on the above information, we derive trading recommendations:
- Buy positions are considered in the area of 1.2885/1.2895, with the prospect of 1.2950-1.3000.
- Sales positions are already available and are being conducted towards 1.2800/1.2770.
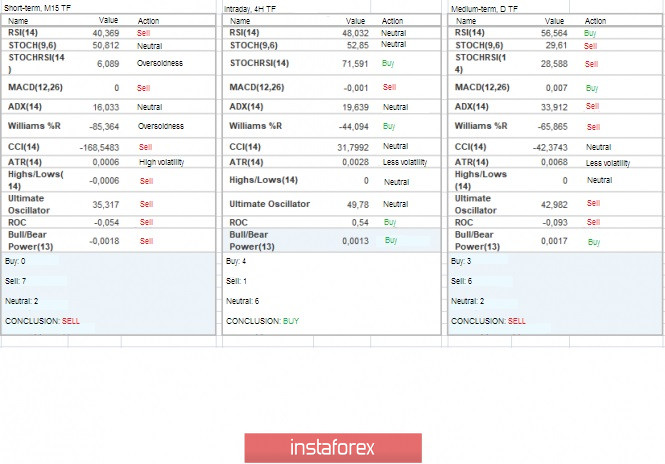
Indicator analysis
Analyzing different sector timeframes (TF), we see that the indicators on the short-term intervals variably slide relative to the boundaries of accumulation. The intraday outlook is working on the recent momentum and price rebound from the benchmark level. The medium-term outlook has consistently maintained downward interest.
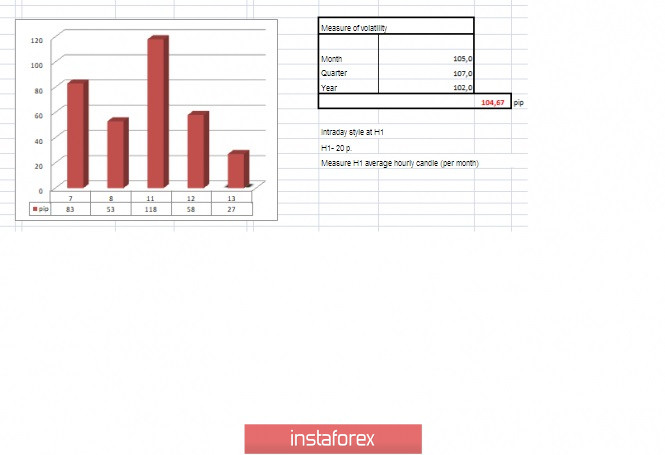
Volatility per week / Measurement of volatility: Month; Quarter; Year
Measurement of volatility reflects the average daily fluctuation, calculated for the Month / Quarter / Year.
(November 13 was built taking into account the time of publication of the article)
The volatility of the current time is 27 points, which is a low value for this period. It is likely to assume that in the case of a break in the existing accumulation, we can see an acceleration in terms of volatility.
Key levels
Resistance zones: 1.3000; 1.3170**; 1.3300**.
Support zones: 1.2770**; 1.2700*; 1.2620; 1.2580*; 1.2500**; 1.2350**; 1.2205(+/-10p.)*; 1.2150**; 1.2000***; 1.1700; 1.1475**.
* Periodic level
** Range level
*** The article is based on the principle of conducting transactions, with daily adjustments.