Over the last trading day, the EUR/USD currency pair showed volatility close to the average daily point of 54 points, resulting in an amplitude where the opening point of the day almost coincided with the closing point.
From technical analysis, we see that in a short period, a V-shaped oscillation was formed, where the fulcrum was found in the area of the psychological level of 1.1000, followed by a return to the same framework of accumulation, with which everything began. The process of partial recovery of the quotation took place, but the sellers did not manage to stay on the background of the information flow, forming impulse jumps in the market. Analyzing the past day hourly, we see that the most remarkable jump in prices occurred at 17:00 (time on the trading terminal), the reason for the surge is the information background and banal emotions of market participants. If we consider fellow market GBPUSD, we will see a synchronous oscillation, but with a wider amplitude.
As discussed in the previous review, speculators were working on the recovery phase of the quote as early as October 11, where the reduction target was towards 1.1000, which coincided by 100%. Some technical correction/rollback was expected, but the result was an overlay of emotions and technology.
Looking at the trading chart in general terms (the daily period), we see that the last two days have not led to anything, there is a characteristic stagnation above the psychological mark of 1.1000, where the prerequisites for the formation of the so-called oblong correction are still preserved. Let me remind you that the correction process came on October 1, and during this time, the quote managed to rebound by about 180 points.
The news background of the past day contained inflation data in France, where a slowdown from 1.0% to 0.9% was recorded. No more statistics came out, and the main emphasis was on the information background. There was information that the EU is close to creating a draft agreement on Brexit, the EU's chief negotiator Michel Barnier said: "Even though reaching an agreement is becoming more and more difficult, it is still possible this week." Speculators regarded this information as manna from heaven, and the currency market locally soared. Has anything changed in the Brexit process? No way! I want to note that in all conversations, we are talking about a project that has yet to be approved by the European Union, and the summit is already on the nose (October 17-18). Of course, I understand that earlier there was a rumor that the EU supposedly will hold another summit at the end of the month, but probably everyone forgot about the UK Parliament, which also has to approve this miracle project. What it all leads to – to the fact that everything is done in a hurry and there will be a lot of questions that someone will ask.
Let's cool off a bit from the process and look to the West. Now, the head of the St. Louis Fed, James Bullard, said yesterday that he is already opposed to cutting rates and believes that it is more appropriate to conduct a more aggressive easing of policy. Let me remind you that the main supporter of the interest rate cut is the head of the Minneapolis Fed, Neel Kashkari.
Today, in terms of the economic calendar, data on inflation in Europe have already been released, where, as expected, there was a slowdown, but stronger than previously forecast, 1.0% – 0.8%. In the afternoon, we are waiting for data on retail sales in the United States, where they expect a slowdown of 4.1% to 3.8%. In turn, work on the elaboration of the draft Brexit agreement is still underway, thus bursts of information are possible.
Further development
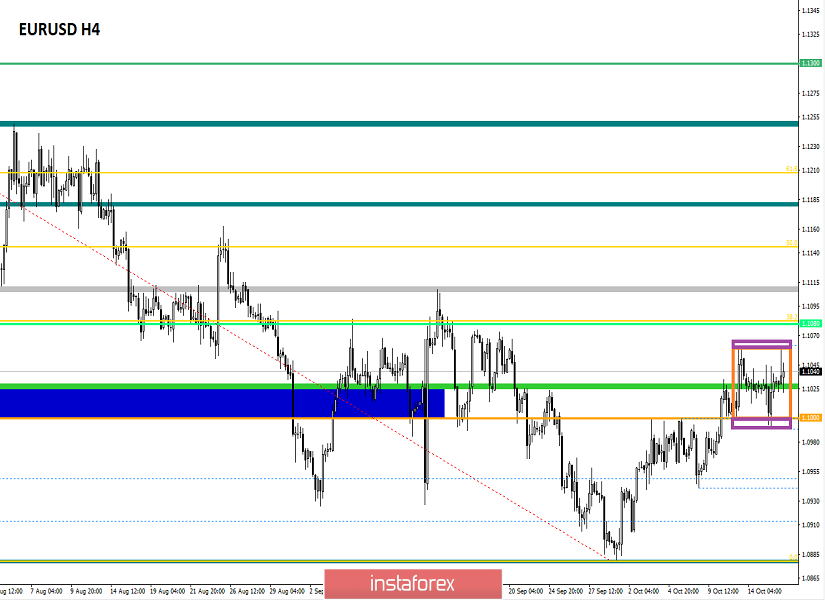
Analyzing the current trading chart, we see that the quote locally touched the peak on October 11, after which there was again a pullback in the framework of the previous accumulation. In fact, for the third day in a row, we see movement along the coordinate 1.1030, with local spikes within the day. So today, detailing the day, we will see the first spike around 9:00, followed by a reverse.
In turn, speculators took a wait-and-see position, as the price movement is extremely uncertain and it is better to select the most solid values, from which it will be possible to work.
It is likely to assume that the fluctuation relative to the existing accumulation will continue for some time, where it is worth looking closely at such signs as 1.0990 and 1.1065, concerning which work will be carried out. That is, it is not so profitable to jump inside these frames than to work on the main movement, thus it is necessary to identify clear fixations relative to the specified boundaries and already enter the market in an inertial course.
Based on the above information, we derive trading recommendations:
- We consider purchase positions in case of price-fixing higher than 1.1065.
- We consider selling positions in case of price-fixing lower than 1.0990.
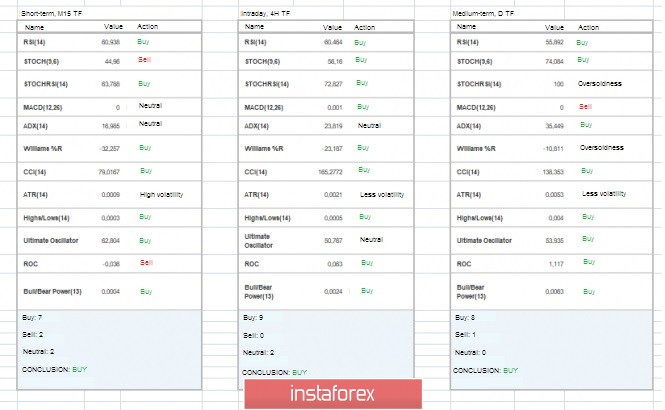
Indicator analysis
Analyzing different sector timeframes (TF), we see that the indicators on all major time intervals signal an upward interest. Only it is worth considering that the medium-term perspective is focused on the corrective course, but the intraday and short-term variable jump due to the information background and horizontal movement.
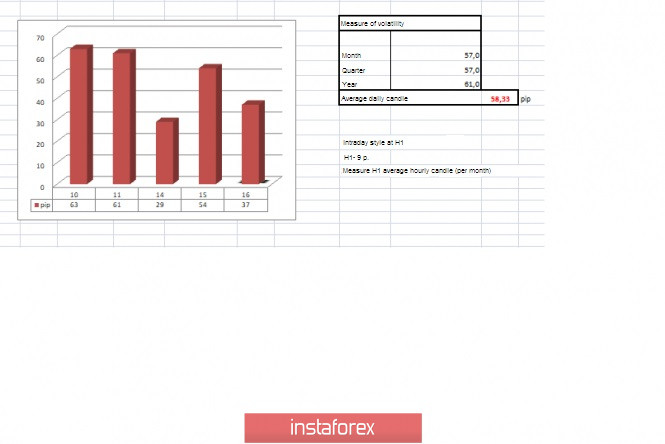
Volatility per week / Measurement of volatility: Month; Quarter; Year
Measurement of volatility reflects the average daily fluctuation, calculated for the Month / Quarter / Year.
(October 16 was built taking into account the time of publication of the article)
The volatility of the current time is 37 points, which is the average for this period. It is likely to assume that in the case of horizontal movement in the existing accumulation, it is not necessary to wait for ultra-high volatility. The breakdown of the indicated frames in combination with the information background can give the same dynamics to the market.
Key levels
Resistance zones: 1.1100**; 1.1180*; 1.1300**; 1.1450; 1.1550; 1.1650*; 1.1720**; 1.1850**; 1.2100
Support zones: 1.1000***; 1.0900/1.0950**; 1.0850**; 1.0500***; 1.0350**; 1.0000***.
* Periodic level
** Range level
*** Psychological level
**** The article is based on the principle of conducting transactions, with daily adjustments.