From a comprehensive analysis, we see a slowdown expressed in the sideways course, where the activity is still high. Now, about the details. For more than 50 hours, the characteristic uncertainty in further actions remains, expressed in the variable frame of 1.2280/1.2480 (1.2500). As we can see, the movement is exclusively horizontal, but the activity is extremely high. In fact, this is a kind of variable platform, where traders have already noticed possible patterns of "double top", "triple top", which could theoretically signal a possible downward turn relative to the inertia of the past week. In this theory, it is worth considering that the market is now highly exposed to external background and elements of technical analysis may literally not work in the mechanics that were originally developed. I would advise you to consider the existing slowdown as a platform for future acceleration, regardless of the direction. In other words, we have returned to the tactics described in previous reviews, that is, working on local positions does not matter the trend. This approach is now followed not only for the pound/ dollar pair, but also for the euro/dollar and other trading instruments.
Naturally, no one forgot about the global trend and almost 100% probability the downward trend in the English currency will continue, but while high activity is raging, there are local movements of considerable scale that can mislead market participants. In such fluctuations, as now, it makes sense not to sit outside the market, but to work with the prospect of 1-2 days, while having a solid income.
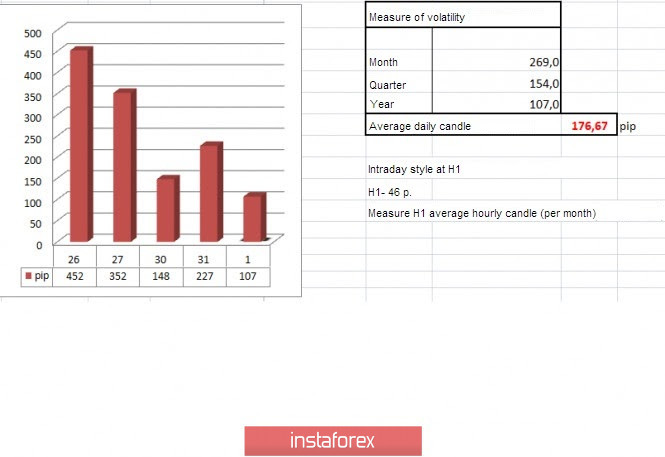
In terms of volatility, we see that the dynamics again recorded growth, which is 28% higher than the daily average. Let me remind the reader that we are at a characteristic standstill, and the volatility is so high that six months ago only an inertia move could boast of such a fluctuation.
Volatility details: Monday-165 points; Tuesday-245 points; Wednesday-172 points; Thursday-358 points; Friday-359 points; Monday-144 points; Tuesday-271 points; Wednesday-676 points; Thursday-354 points; Friday-522 points; Monday-267 points; Tuesday-296 points; Wednesday-333 points; Thursday-452 points; Friday-352 points; Monday-148 points; Tuesday-227 points. The average daily indicator relative to the volatility dynamics is 175 points (see the volatility table at the end of the article).
As discussed in the previous review, traders analyzed the price dynamics relative to the level of 1.2280/1.2350, where the purchase positions were eventually made.
Tuesday's recommendations regarding local buy positions coincided with the profit.
(We consider buying positions if the price is fixed higher than 1.2370, with the prospect of a move to 1.2445-1.2500.)
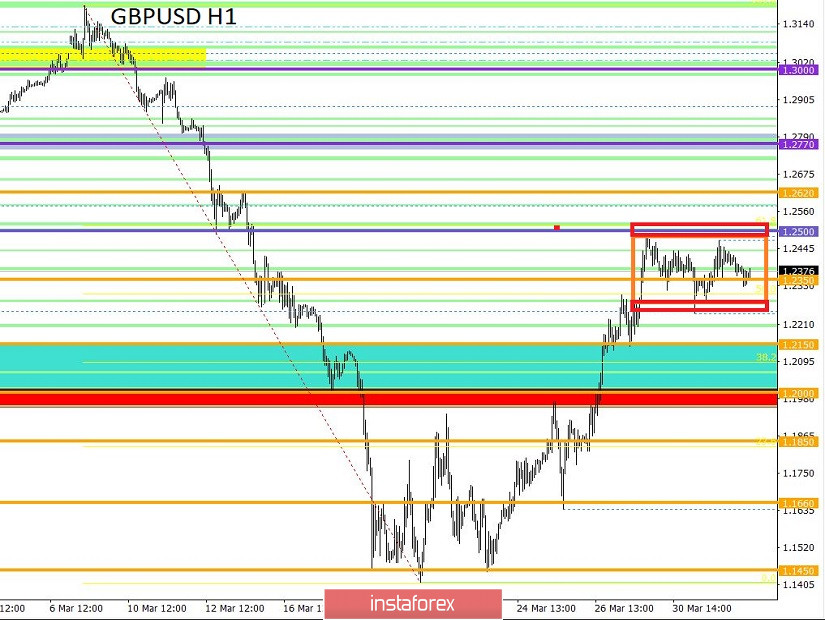
Looking at the trading chart in general terms (daily period), we see that at the peak of the upward movement of the past week, a stagnation formed, where the quote leads the concentration in the horizontal range.
The news background of the past day included the final data on UK GDP for the fourth quarter, which recorded a slowdown in economic growth from 1.2% to 1.1%. In the second half of the day, data on the S&P/CS Composite-20 housing price index without seasonal fluctuations (US) was published, where they recorded an increase from 2.8% to 3.1%.
In terms of the general information background, we see the COVID-19 virus spreading around the world, where the number of infected people is growing every day, and the consequences of everything that is available are waiting for us ahead. So, the British economy, which was already going through bad times, may soon face a recession, according to experts from Bloomberg. In turn, the government and banks are doing their best to help those affected by the coronavirus crisis.
Brexit, which has gone by the wayside, is waiting for specifics from England, as it is not very clear whether the parties will have time to resolve all non-urgent issues before the end of the transition period. This issue is more of a concern for the European side, which is asking questions since negotiations are suspended due to the coronavirus, but the UK continues to maintain the status quo. The ambitious exit schedule is cracking, and the main question now is when England will still agree to extend the transition period. Let me remind you that the main Brexit negotiators from England and Brussels are in self-isolation due to infection with coronavirus.
Today, in terms of the economic calendar, we have another data on the labor market in the United States, where, according to the ADP report, employment should fall by more than 150,000 and again a kind of shock for the market. Thus, the US dollar will again be under local pressure, losing its position.
Further development
Analyzing the current trading chart, we see that the movement within the slowdown continues at 1.2280/1.2480 (1.2500), where the quote is fluctuating within the mark of 1.2350. In fact, there is conditional testing of the lower border, where a return to the area of 1.2445/1.2480 is not excluded. It is worth noting that this is a fluctuation within the range, and due to the fact that its value already exceeds 50 hours, the range is considered not stable and a speedy breakdown is possible. Thus, the main strategy is considered to work on the breakdown of the main range boundaries, and we should not forget that all positions are considered local.
From the point of view of the emotional mood of market participants, we see that the coefficient of speculative positions is high, and this is confirmed by the volatility inside the slowdown. There are no signs of slowing down or reducing speculative activity yet.
In turn, traders work both inside the existing range and on its breakdown, which is now a very profitable occupation.
Having a general picture of actions, we can assume that the main strategy will be to work on the breakdown of the range of 1.2280/1.2480 (1.2500), but due to its large width, you can try to conduct transactions within the framework.
Based on the above information, we will output trading recommendations:
- Buy positions are considered higher than 1.2400, with the prospect of a move to 1.2450-1.2480. The main positions will come after fixing the price above 1.2500, with the prospect of a move to 1.2620.
- We consider selling positions if the price is fixed below 1.2280, with the prospect of a move to 1.2245-1.2200.
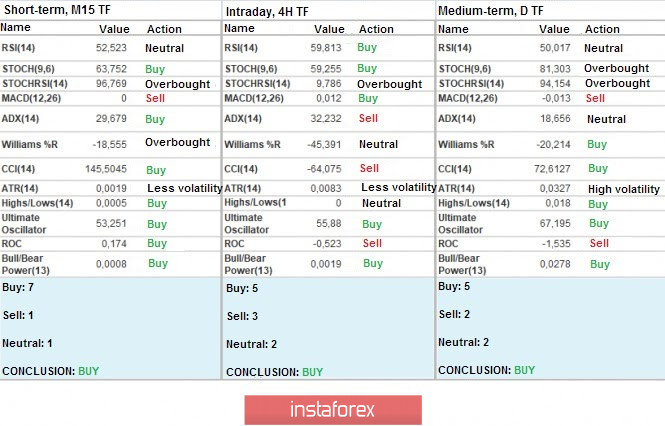
Indicator analysis
Analyzing different sectors of timeframes (TF), we see that the indicators of technical instruments work within a broad slowdown, thus indicators at minute and hour intervals have variable signals. Daily periods still retain a buy signal due to the upward movement of the past week.
Volatility for the week / Measurement of volatility: Month; Quarter; Year.
Volatility measurement reflects the average daily fluctuation, calculated for the Month / Quarter / Year.
(April 1 was based on the time of publication of the article)
The volatility of the current time is 107 points, which is even less than the daily average, but it is also a signal of possible early acceleration. It is likely to assume that the external background, together with statistical data for the United States, will accelerate the movement in the market.
Key levels
Resistance zones: 1.2350**; 1.2500; 1.2620; 1.2725*; 1.2770**; 1.2885*; 1.3000; 1.3170**; 1.3300**; 1.3600; 1.3850; 1.4000***; 1.4350**.
Support zones: 1.2350**; 1.2150**; 1.2000*** (1.1957); 1.1850; 1.1660; 1.1450 (1.1411); 1.1300; 1.1000; 1.0800; 1.0500; 1.0000.
* Periodic level
** Range level
*** Psychological level
****The article is based on the principle of conducting a transaction, with daily adjustments.