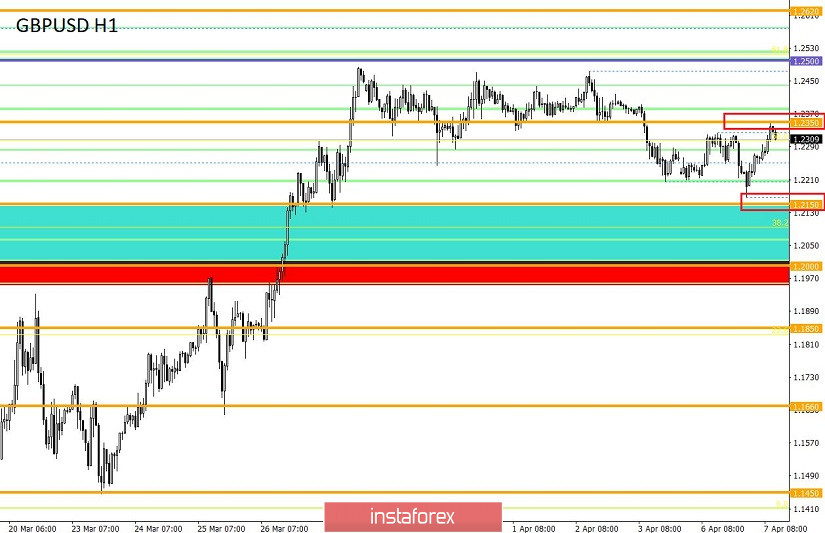
From the point of view of a comprehensive analysis, we see a price shift relative to an earlier flat, and now about the details. The price fluctuation in the structure of the lateral channel 1.2280 // 1.2380 // 1.2480 was broken after a local breakdown of the lower border last Friday. After that, the quote outlined a new framework, where the predicted level of the variable support of 1.2150 became the lower border, and the area of interaction of trade forces 1.2320 / 1.2350 became the upper border. In fact, the existing fluctuation reflects a kind of slowdown, where market participants remain cautious in their actions.
Regarding the theory of further development, traders continue to incline towards a possible continuation of the downward move, where the quote will focus on variable ranges at first, which will embody the ambiguity in the actions of the crowd, and after that, the main movement will gradually resume.
The local actions are not as simple as it was in March. The market is adapting to the external background and, possibly, we will return to the tactics of following the main trends soon.
Analyzing the trading chart by the minute, we see a variable fluctuation within the lower border of the flat, where the main jump has already taken place between 19:00-21:00 [UTC+00 time on the trading terminal].
In terms of volatility, we see another decrease in activity, where the Monday indicator did not reach the average daily level of as much as 35%, and the daily candle was "Doji". It is worth considering that the dynamics are still high in comparison with the periods before the pandemic in the world. Over time, volatility indicators will recover and a level of 90-110 points will be considered the norm.
Details of volatility: Monday - 165 points; Tuesday - 245 points; Wednesday - 172 points; Thursday - 358 points; Friday - 359 points; Monday - 144 points; Tuesday - 271 points; Wednesday - 676 points; Thursday - 354 points; Friday - 522 points; Monday - 267 points; Tuesday - 296 points; Wednesday - 333 points; Thursday - 452 points; Friday - 352 points; Monday - 148 points; Tuesday - 227 points; Wednesday - 108 points; Thursday - 126 points; Friday - 198 points; Monday - 116 points. The average daily indicator, relative to the dynamics of volatility is 181 points [see table of volatility at the end of the article].
As discussed in a previous review, traders considered a downward development in the case of fixing prices lower than 1.2200, but expectations were not met.
The recommendation from Monday regarding short positions partially coincided, receiving a profit on your deposit.
[We consider selling positions in two versions: the first is lower than 1.2270, with the prospect of a move to 1.2220; the second option proceeds from the main development, where the quote needs to be fixed lower than 1.2200, with the prospect of a move to the psychological level of 1.2000.]
Considering the trading chart in general terms [the daily period], we see the retention of quotes at the top of the upward inertia. The global downward trend remains downward.
The news background of the past day contained data on the index of business activity in the UK construction sector, where they recorded a strong decline from 52.6 to 39.3 with a forecast of 44.0.
The market's reaction to the statistics was practically absent, but against the general background, the pound still started to decline towards evening.
In terms of the general informational background, we see that the epidemiological situation in the world is not the best, the growth of COVID-19 viruses has already reached more than 1.34 million, anti-records in some regions continue to shock.
In turn, British Prime Minister Boris Johnson, who was diagnosed with coronavirus in March, was transferred from self-isolation to the intensive care unit due to deterioration of his well-being. He was replaced by Foreign Minister Dominic Raaba.
This kind of background does not play in favor of the pound, and it is still waiting for the devastating effects of containment measures on the economy of the United Kingdom.
Today, in terms of the economic calendar, we have data on JOLTS open vacancies in the United States, where they expect reductions from 7.0 million to 5.6 million.
Further development
Analyzing the current trading chart, we see that the area of interaction between the trading forces 1.2320 / 1.2350 still provides a kind of resistance, slowing down buyers. In fact, we keep the fluctuations limited in scale, and the echoes of the passed flat remain among the traders.
Examining the time interval by the minute, it was recorded that the inertia set during the closing period of the previous day was retained in the market, during which the quote still managed to get closer to the level of 1.2150, but also quickly rebounded from it. At this very moment, an ascending move arises, which leads us to the level of 1.2350.
In terms of the emotional background, we see a distinct slowdown, but for speculators it is still an acceleration, and this may need to be earned.
It can be assumed that the fluctuation in the range of 1.2150 / 1.2350 is still preserved, where you can work both on the breakdown of the established boundaries and inside them, the width of the range allows this.
Based on the above information, we derive trading recommendations:
- We consider selling positions in case of price fixing higher than 1.2350, with the prospect of a movement to 1.2400-1.2450.
- We consider buying positions lower than 1.2300, with the prospect of a movement to 1.2220-1.2170. The main movement is considered after fixing the price lower than 1.2150.
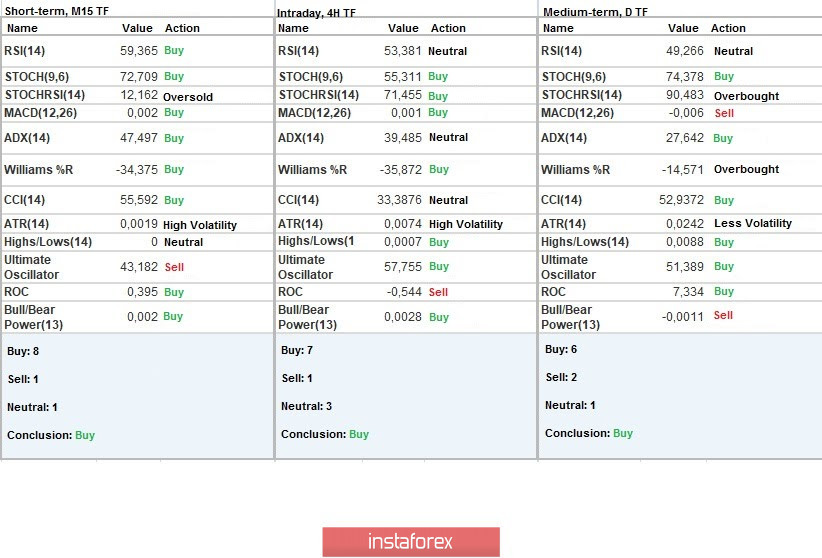
Indicator analysis
Analyzing a different sector of time frames (TF), we see that the indicators of technical instruments focused on the buy signal, since the price is still at the peak of the inertial upward movement, and the oscillation is inside a variable flat.
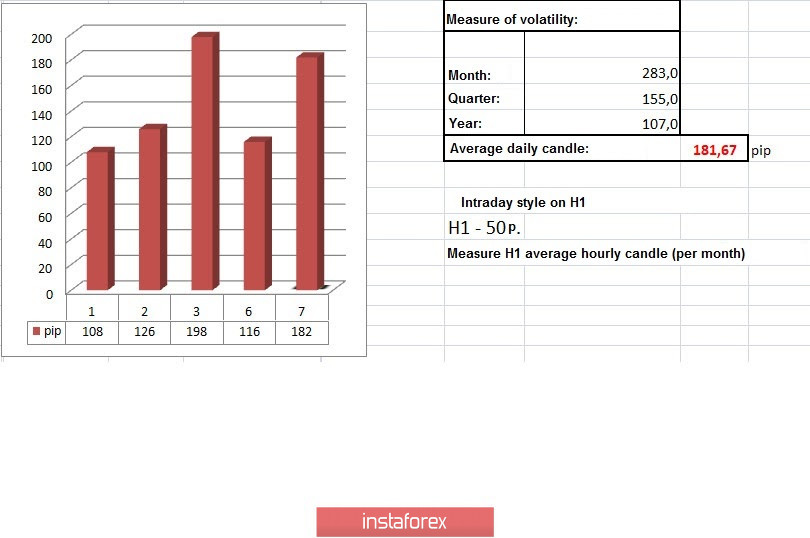
Volatility per week / Measurement of volatility: Month; Quarter; Year
Measurement of volatility reflects the average daily fluctuation, calculated for Month / Quarter / Year.
(April 7 was built taking into account the time of publication of the article)
The volatility of the current time is 182 points, which is almost the value of the average daily value. It can be assumed that if the boundaries of the established variable flat do not fall, then the volatility will remain within the existing value.
Key levels
Resistance zones: 1.2350 **; 1.2500; 1.2620; 1.2725 *; 1.2770 **; 1.2885 *; 1.3000; 1.3170 **; 1.3300 **; 1.3600; 1.3850; 1.4000 ***; 1.4350 **.
Support Areas: 1.2280 (1.2240); 1.2150 **; 1.2000 *** (1.1957); 1.1850; 1.1660; 1.1450 (1.1411); 1.1300; 1,1000; 1.0800; 1.0500; 1.0000.
* Periodic level
** Range Level
*** Psychological level
**** The article is built on the principle of conducting a transaction, with daily adjustment