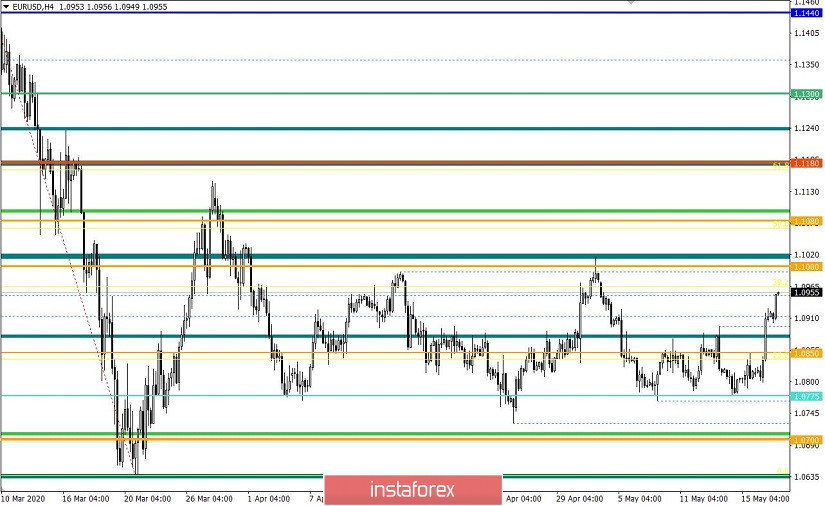
From the point of view of complex analysis, you can see a surge in activity, during which a variable range was broken, and now let's talk about the details. The quote followed a variable range of 1.0775 / 1.0850 (1.0880) for seven consecutive trading days, showing low activity and indicating the accumulation process, but everything changed on the last day. The US dollar, regardless of the trading instrument, began to sharply lose its gained position, having an inertial course, in particular, for the euro/dollar currency pair. On an impulse, market participants quickly broke through the mirror level of 1.0850, followed by a variable deviation of 1.0880, resulting in a local maximum of 1.0927, but this inertia ended.
Whether this movement should be regarded as a turning point and a violation of all previously derived theories regarding a downward trend, I do not think this is just a local surge, which is unlikely to lead to something significant in the future.
Regarding the main flat formation 1.0775 / 1.1000, it can be seen that the borders remain unchanged, and the activity remotely resembles the movement last April 24, which means that local trading operations are still relevant on the market, which are now generating impressive income .
In terms of further development, we are still considering a downward scenario, which does not come from the latest market impulses, but from general dynamics both in terms of technical and fundamental analysis.
Analyzing the past trading day every minute, you can see that the round of long positions came at 10:00-15:00 UTC+00, after which the consolidation process began.
As discussed in the previous review, market participants were ready for a similar plot, which is why they considered local positions for purchase along with the main development theory.
Monday's trading recommendation for local buy positions coincided by 100%.
[We consider the purchase positions in terms of local operations in case of price consolidating higher than 1.0830, towards 1.0850. We consider a deeper move in case of price consolidating higher than 1.0860, towards 1.0880-1.0900]
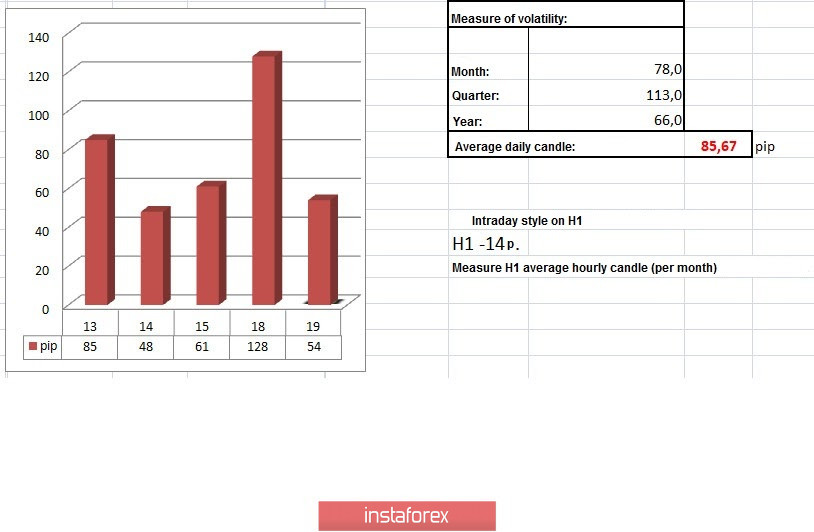
In terms of volatility, the highest activity indicator since the beginning of the month was recorded. Acceleration was an expected occurrence due to a significant slowdown in the period before.
Considering the trading chart in general terms, the daily period, it is worth highlighting a constant downtrend, which has been going on for more than one year. The fluctuation in the intervals since the beginning of the year was extremely volatile, but still the trend has not changed.
There was no news background of the past day in Europe and the United States, while activity was above normal. So what is the reason for such an impressive dynamic? Probably, the impulse for the general weakening of the dollar was the rising oil price, which gained almost 10% in weight. Let me remind you that oil plays the role of a negative correlation in comparison with the US dollar.
In terms of general information background, there is a sharp statement by the head of the Federal Reserve System Jerome Powell in an interview with CBS News, where he predicted a 20-30% reduction in the country's GDP in the second quarter of this year. With all this, Powell believes that the current crisis should not be compared with the Great Depression, since there are fundamental differences.
"I do not think that such an outcome is likely at all. There are a number of very fundamental differences. Firstly, we had a very healthy economy two months ago. And we are talking about an external event, a natural disaster. And there is one significant difference. In the 1920s, when the Depression occurred, when the collapse and everything else happened, the financial system collapsed. Now, our financial system is strong, it is able to withstand what is happening. After the last crisis, we spent 10 years strengthening it. This is a huge difference," Powell emphasized.
In turn, the chief economist of the European Central Bank, Philip Lane, believes that the eurozone economy will suffer significantly from the coronavirus crisis, and we should not expect a quick recovery.
"From today's point of view, in any case, it is unlikely that economic activity will return to its pre-crisis level before 2021, if not later," Philip Lane said.
Today, in terms of the economic calendar, we have data on the volume of construction in Europe and the United States, but all this pales before the summit of the EU heads, where with the filing of Germany they can approve a plan to support the economy in the amount of 500 billion euros.
Further development
Analyzing the current trading chart, we can see that the inertial movement set yesterday was still preserved in the market, where the control psychological level of 1.1000 was not so far away. In fact, the movement inside the main flat remains on the market, where traders should work both on the main positions in the event of breakdown of control borders, and on local operations.
It can be assumed that, no matter how strong the inertial fluctuation, it is not able to change the market mood. Thus, the initial beat will resume on the market in the near future, and the resistance level may become the area of the upper border of the flat 1.1000, where market participants will feel pressure within 50 points of deviation.
Based on the above information, we derive trading recommendations:
- Buying positions if we already have from the breakdown of the maximum of the past day, can be brought to the border of 1.1000.
- Selling positions are considered below 1.0900, in case the quote rebounds from the level of 1.0950. If the quote still reaches the psychological level of 1.1000, then you should already analyze the dynamics and price consolidating points.
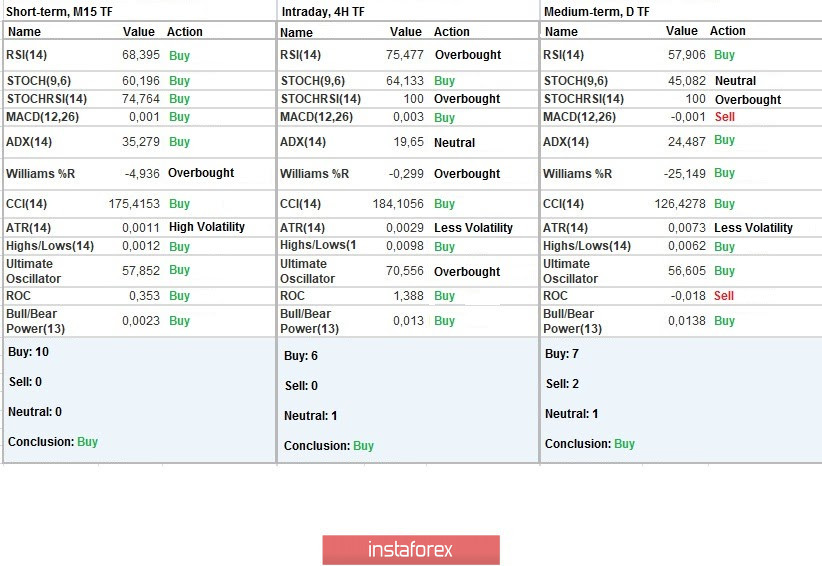
Indicator analysis
Analyzing a different sector of time frames (TF), we see that the performance of technical instruments changed the buy signal due to a strong inertial move.
Volatility per week / Measurement of volatility: Month; Quarter; Year
Volatility measurement reflects the average daily fluctuation calculated for the Month / Quarter / Year.
(May 19 was built taking into account the time of publication of the article)
The volatility of the current time is 54 points, which is lower than the average daily value, but for a given period of time, the activity is quite high. It can be assumed that in the case of maintaining a given speculative mood, volatility can reach the daily average again.
Key levels
Resistance zones: 1,1000 ***; 1.1080 **; 1.1180; 1.1300; 1.1440; 1.1550; 1.1650 *; 1.1720 **; 1.1850 **; 1.2100
Support areas: 1.0850 **; 1.0775 *; 1.0650 (1.0636); 1.0500 ***; 1.0350 **; 1.0000 ***.
* Periodic level
** Range Level
*** Psychological level