EUR/USD 1H
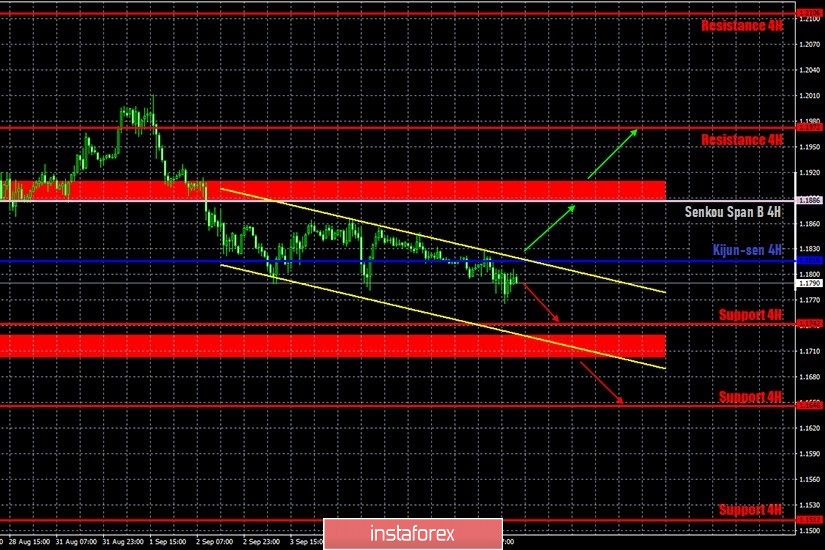
The hourly timeframe on September 8 shows the euro/dollar pair moving in a downward direction, inside the same side channel of $1.17-$1.19. The pair fell by only a few dozen points during the day, and at the same time, it reached 5 (!!!) previous local lows: 1.1754, 1.1772, 1.1762, 1.1789 and 1.1781. As you can see, not only do the bears face problems in going below the level of $1.17, but it has even more difficulty with overcoming the 1.1754-1.1789 area, although it does not even appear as a support area, since there is another support area at 1.1703-1.1729, from which the price also rebounded several times earlier. We believe that these are all signs of continuing the flat. It's just that in our case this flat is unattractive, not like in the textbook. Looking at the 4-hour timeframe, we can say that the upward trend is generally preserved. Looking at the lower timeframes, we can conclude that a new downward trend has begun.
EUR/USD 15M

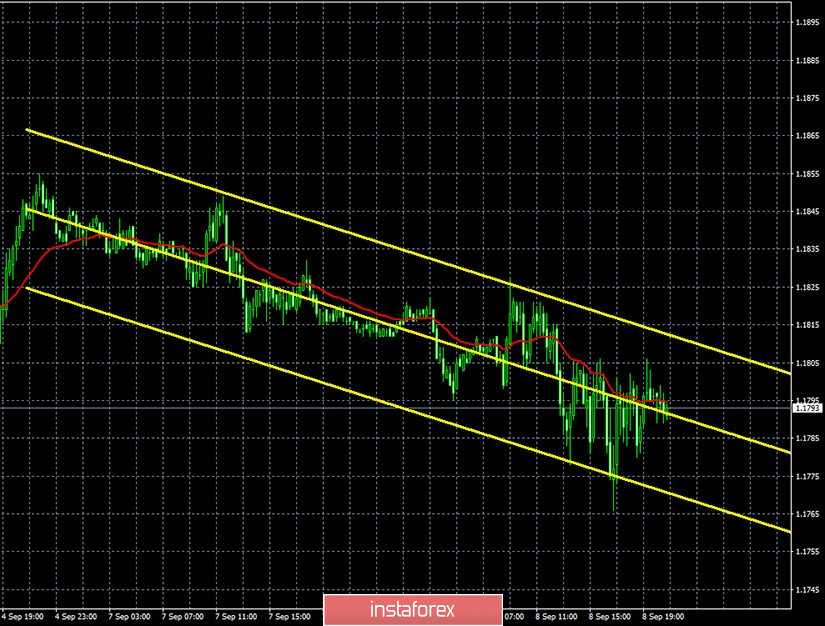
Both linear regression channels turned down on the 15-minute timeframe, signaling a downward movement at this time. The latest Commitment of Traders (COT) report, which, let me remind you, comes out with a three-day delay and only covers the dates from August 26 to September 1, unexpectedly showed a decrease in the net position for the "non-commercial" category of traders. Let me remind you that non-commercial traders are the most important category of traders who enter the foreign exchange market in order to make a profit. So, during the reporting week, non-commercial traders reduced Buy-positions and opened Sell-contracts. The number of purchases decreased by almost 11,000, while the number of sales increased by 3,000. Thus, the net position immediately decreased by 14,000. We would like to take note that the euro did not really get cheaper during the reporting week, which is covered by the latest COT report. The euro strengthened during all five trading days, and it only started to fall on September 1, which we can now describe as being provoked by professional traders and their sell positions. However, we can not consider the overall downward movement as strong, in contrast to the fall, for example, of the pound, for which the COT report did not show that the bullish mood had weakened among non-commercial traders.
The European Union published the GDP for the second quarter in a new estimate. According to the updated data, GDP contracted by 11.8% q/q, instead of 12.1%, as was published a month earlier. Thus, we can say that this report is in favor of the European currency, but the difference between the loss of 12.1% and 11.8% is not large. Therefore, market participants practically did not react to this data in any way, continuing rather vague trades. No important news and data from the US and the EU are scheduled for release today. Therefore, weak volatile trading may continue on September 9. And traders, most likely, will continue to wait for the results of the ECB meeting, which will be summed up on September 10, Thursday. Christine Lagarde's press conference will be held at the same time.
We have two trading ideas for September 9:
1) Bulls continue to keep their finger on the pulse of the market and are ready to return at any time and open new buy positions. At least the current fall in quotes is very weak, and the price has not yet managed to even approach the important level of 1.1700, which we consider as the lower border of the side channel. Thus, it will be possible to buy the pair in case it settles above the Kijun-sen line (1.1816) and a descending channel with targets of Senkou Span B line (1.1886) and the 1.1972 level. Take Profit in this case will be from 50 to 130 points.
2) Bears got the opportunity to start forming a new downward trend, but so far they are not taking full advantage of it. Thus, for now, we can recommend selling the pair while aiming for the support level of 1.1742, and even then you have to be extremely cautious, since the movement is very weak. In this case, the potential Take Profit is 40 points.
Explanations for illustrations:
Support and Resistance Levels are the levels that serve as targets when buying or selling the pair. You can place Take Profit near these levels.
Kijun-sen and Senkou Span B lines are lines of the Ichimoku indicator transferred to the hourly timeframe from the 4-hour one.
Support and resistance areas are areas from which the price has repeatedly rebounded off.
Yellow lines are trend lines, trend channels and any other technical patterns.