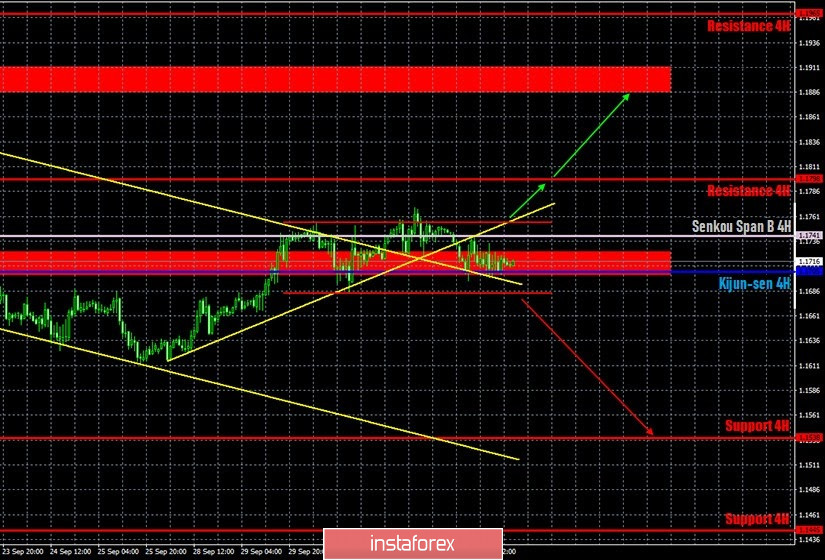
EUR/USD 1H
The euro/dollar pair traded all day on the hourly timeframe on October 2 as if it were a semi-weekend or a holiday. All trades were held between the Senkou Span B and Kijun-sen lines, which are generally strong lines and signals appeared upon breaking or rebounding from them. However, we had a distinct flat on Friday. We even formed a horizontal channel capped at 1.1683 and 1.1756. And the pair has been trading between these levels for several days. What caused the new flat? Most likely a fundamental background. From a technical point of view, the dollar should continue to rise, since we have not seen a sane correction following the 1300-point rally.
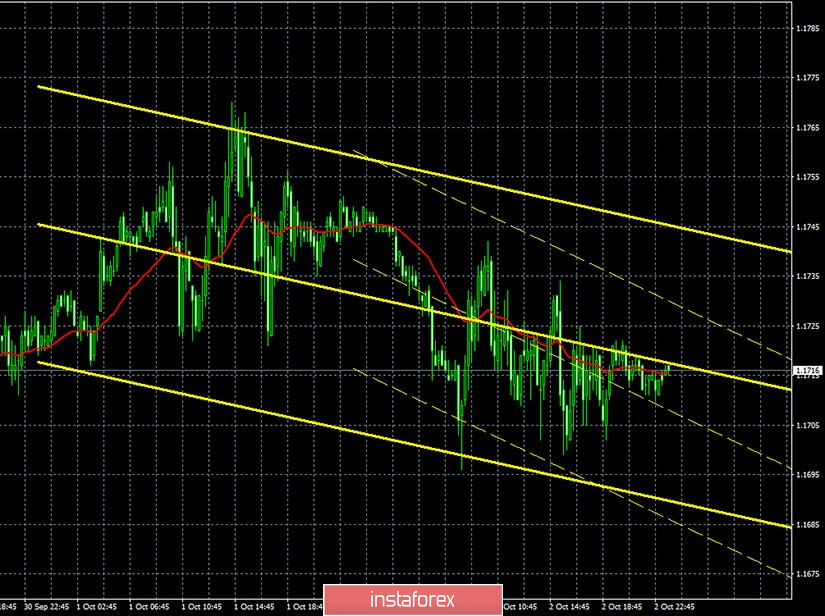
EUR/USD 15M

Both linear regression channels are directed to the downside on the 15-minute timeframe, indicating that traders are now more inclined to overcome the lower channel line at 1.1683-1.1756. The euro/dollar rose in price by around 30 or 40 points during the last reporting week (September 23-29). We cannot even call it growth, just a normal market noise. The previous Commitment of Traders report showed that non-commercial traders opened 15,500 new Buy-contracts (longs) and almost 6,000 Sell-contracts (shorts). Thus, the net position for this group of traders increased by around 9,000. The new report clearly reflects what is currently happening in the foreign exchange market. Professional traders closed 4,500 contracts for buy positions on the euro and 3,300 contracts for sell-positions during the reporting week. That is, the net position for the "non-commercial" group has decreased by around a thousand contracts, that is, the mood of large traders has become a little more bearish. However, these are not changes that can be acknowledged as global. Therefore, we conclude that the situation has not changed dramatically. The EUR/USD pair generally stood in one place for the next three trading days (after September 29). Therefore, the next COT report can be as uninformative as possible.
The European Union recently published a report on inflation for September (preliminary value). It turns out that the consumer price index fell even more and now stands at -0.3% y/y. Core inflation also fell to just 0.2% y/y. This is very, very bad news for the euro and the European Union. It is extremely difficult for an economy to show growth without inflation. News from overseas did not fare any better. We have already mentioned that US President Donald Trump has been infected with the coronavirus. The NonFarm Payrolls report turned out to be weaker than the experts' forecasts and reached 661,000 new jobs in September instead of the expected 850,000. Average hourly wages rose by only 0.1% in September. And traders were only pleased by the unemployment rate, which dropped to 7.9%. However, all these rather important reports did not have any impact on the foreign exchange market, which continued to move throughout the day in a range of no more than 50-60 points wide.
We have two trading ideas for October 5:
1) Buyers did not have enough strength to sustain the upward movement so that it could go beyond the 1.1756 level. Thus, further strengthening of the euro is now in question. A horizontal channel at 1.1683-1.1756 has appeared and we recommend that you wait until the price settles above it in order to possibly open new long positions while aiming for 1.1798 and 1.1886. Take Profit in this case will be from 20 to 110 points.
2) Bears have finally released the market from their hands, but may still return to it if they manage to get the pair to settle below the 1.1683-1.1756 horizontal channel. In this case, we recommend opening new short positions while aiming for 1.1538. All support and resistance levels will be reviewed tomorrow. In this case, the potential Take Profit is up to 130 points.
Explanations for illustrations:
Support and Resistance Levels are the levels that serve as targets when buying or selling the pair. You can place Take Profit near these levels.
Kijun-sen and Senkou Span B lines are lines of the Ichimoku indicator transferred to the hourly timeframe from the 4-hour one.
Support and resistance areas are areas from which the price has repeatedly rebounded off.
Yellow lines are trend lines, trend channels and any other technical patterns.