To open long positions on EUR/USD, you need:
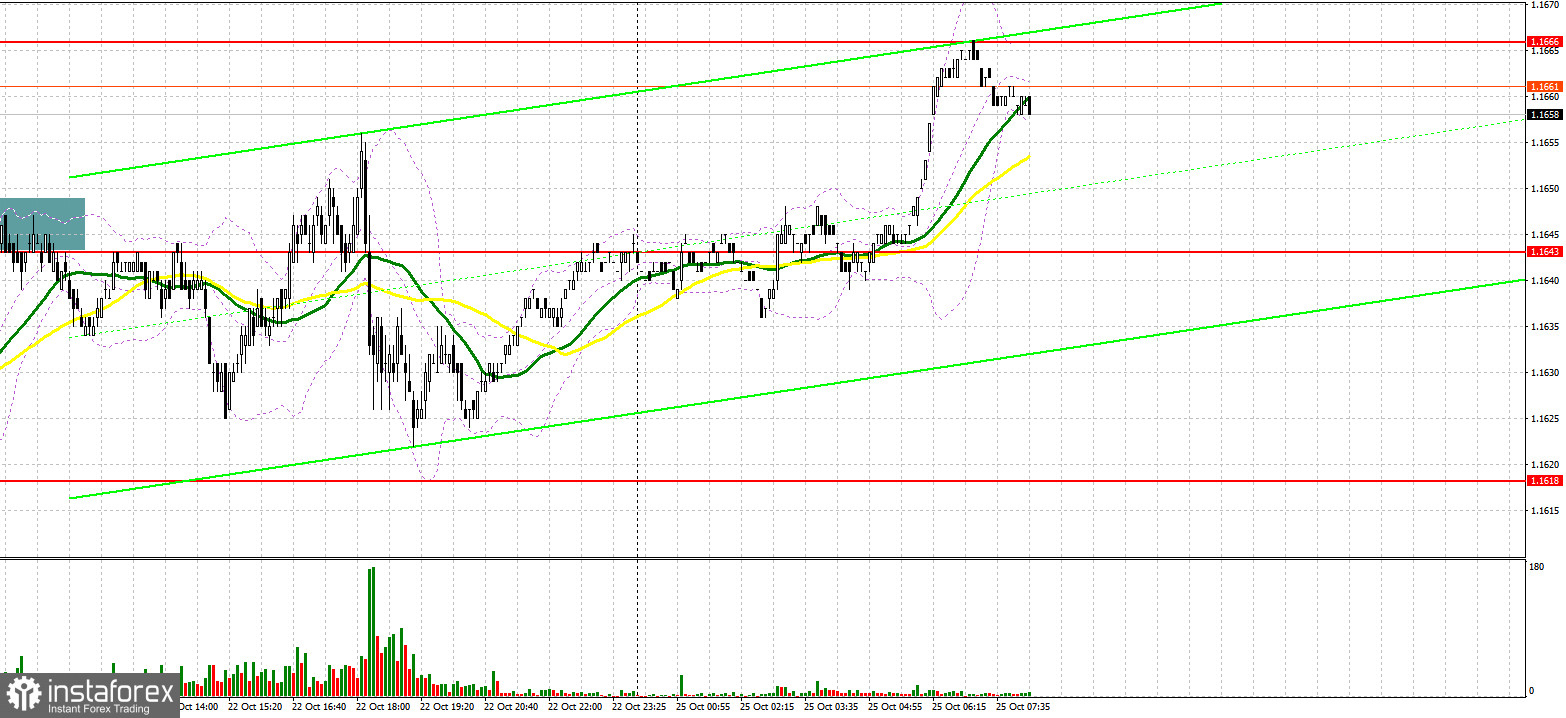
Last Friday, against the background of low volatility, only one signal to enter the market was formed. Let's take a look at the 5 minute chart and understand the entry point. In my morning forecast, I paid attention to the resistance at 1.1643 and advised you to make decisions from it. Comprehensive statistics on activity in the eurozone countries did not allow the bulls to rise above 1.1643, which led to the formation of a false breakout. The general downward movement was 20 points, after which the pressure on the euro eased. Strong data on activity in the US kept the pair in a horizontal channel.
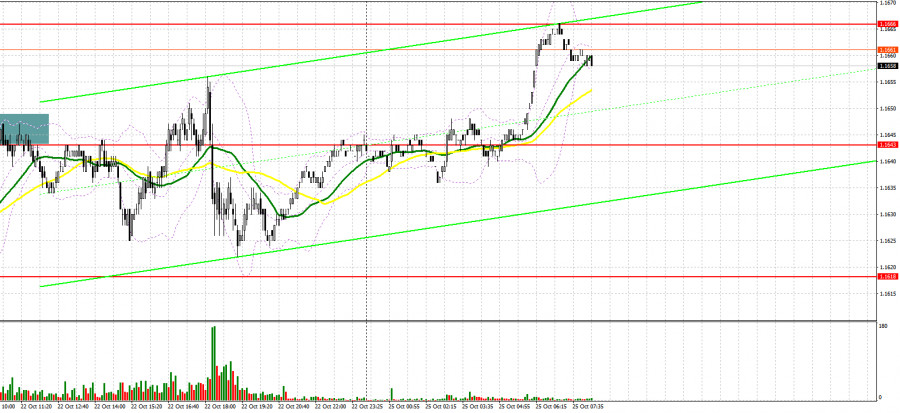
Today there are no important statistics for the euro area, but the euro's growth may be limited by the report from the German IFO institute on the indicator of the business environment for October this year. Weak indicators, which are predicted by economists, are unlikely to allow the bulls to rise above the weekly resistance of 1.1666. In order to count on further recovery of EUR/USD, it is necessary to break above 1.1666. Only a consolidation in this range, as well as its reverse test from top to bottom, can create a signal to buy the euro, which will allow us to see the continuation of the upward trend with the prospect of recovery in the 1.1691 and 1.1713 areas, where I recommend taking profits. The next target will still be the area of 1.1742. In case of maintaining pressure on the pair, an equally important task is to protect the middle border of the horizontal channel at 1.1643, where the moving averages, playing on their side, pass. Forming a false breakout there creates a good entry point into long positions. If the bulls are not active at this level, I advise you to postpone long positions to the 1.1618 area, which is the lower border of the horizontal channel. It is best to buy the pair immediately on a rebound from the 1.1593 low and only counting on 15-20 correction points at once.
To open short positions on EUR/USD, you need:
The bears have completely lost the initiative in today's Asian session, allowing the pair to reach the upper border of the horizontal channel. Now it is necessary to protect it. Only a false breakout there will return the real pressure on EUR/USD, which will push it to the middle border of 1.1643. A breakthrough and test of this level from bottom to top, along with weak data from the IFO Institute for Germany, will result in forming a signal to open new short positions with a subsequent return to the area of the lower border of the horizontal channel at 1.1618. A breakdown of this range too will lead to the demolition of the bulls' stop orders located below. This will quickly bring EUR/USD to 1.1593 and open a direct road to 1.1573, where I recommend taking profits. The next target will be the area of 1.1542. A test of this range would mean a resumption of the bearish market for the euro. In case the bears are not active at 1.1666, it is best to postpone selling until the test of a new high at 1.1691, and opening short positions immediately on a rebound counting on a downward correction of 15-20 points is possible from a larger resistance at 1.1713.
I recommend for review:
The Commitment of Traders (COT) report for October 12 revealed an increase in both short and long positions, but there were more of the former, which slightly reduced the negative delta. Political problems in the United States of America have been resolved, and the latest fundamental reports continue to delight traders, which testifies to the continued good pace of the American economic recovery. The fact that the Federal Reserve is already seriously considering scrapping the bond buying program is no longer news that could help dollar bulls at the moment. But the fact that representatives of the European Central Bank began to express concern about the rate of inflation, albeit not in the same form as their colleagues from the Fed - all this allows the European currency to begin to gradually win back its positions. This trend may continue in the future, especially in the case of strong statistics on the European economy. However, the larger medium-term demand for risky assets will remain limited due to the wait-and-see attitude of the ECB. The COT report indicated that long non-commercial positions rose from 196,819 to 202,512, while short non-commercial positions jumped from 219,153 to 220,910. By the end of the week, the total non-commercial net position rose slightly to -18 398 against -22,334. The weekly closing price dropped to 1.1553 against 1.1616.
Indicator signals:
Moving averages
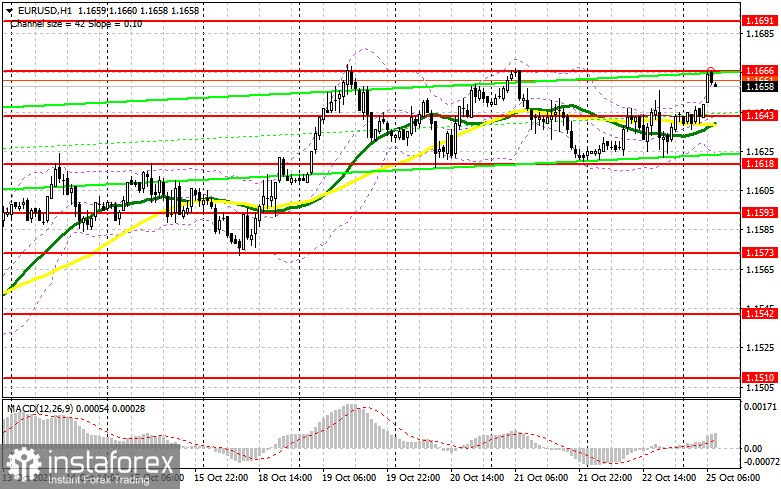
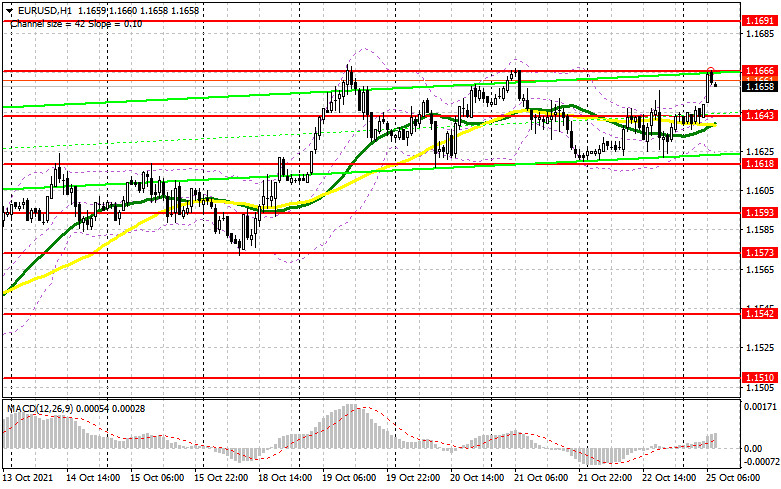
Trading is carried out above the 30 and 50 day moving averages, which indicates an attempt by the bulls to resume the growth of the market.
Note: The period and prices of moving averages are considered by the author on the H1 hourly chart and differs from the general definition of the classic daily moving averages on the daily D1 chart.
Bollinger Bands
A breakthrough of the upper border of the indicator around 1.1666 will lead to a new wave of euro growth. Surpassing the lower border of the indicator in the area of 1.1620 will increase the pressure on the pair.
Description of indicators
- Moving average (moving average, determines the current trend by smoothing out volatility and noise). Period 50. It is marked in yellow on the chart.
- Moving average (moving average, determines the current trend by smoothing out volatility and noise). Period 30. It is marked in green on the chart.
- MACD indicator (Moving Average Convergence/Divergence — convergence/divergence of moving averages) Quick EMA period 12. Slow EMA period to 26. SMA period 9
- Bollinger Bands (Bollinger Bands). Period 20
- Non-commercial speculative traders, such as individual traders, hedge funds, and large institutions that use the futures market for speculative purposes and meet certain requirements.
- Long non-commercial positions represent the total long open position of non-commercial traders.
- Short non-commercial positions represent the total short open position of non-commercial traders.
- Total non-commercial net position is the difference between short and long positions of non-commercial traders.