The single European currency continues to confidently go up, and objectively speaking, it had every reason for this yesterday. Although it must be admitted that the euro's growth rate is so impressive that a correction involuntarily begs. Witnesses of which, most likely, we will become today. But first things first.

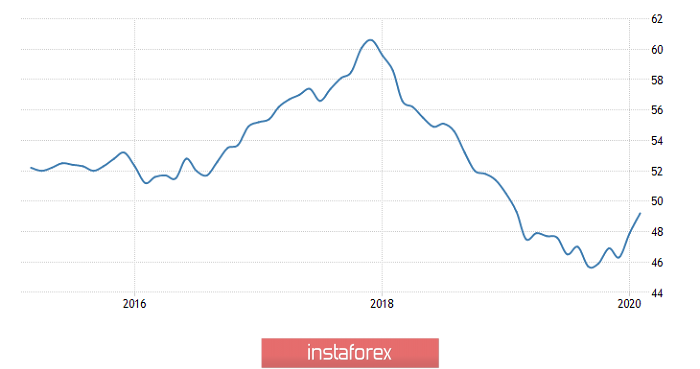
The euro solely grew during the European session due to the final data on the index of business activity in the manufacturing sector, which grew from 47.9 to 49.2, with a forecast of 49.1. This, of course, does not mean the end of the decline in industrial production lasting more than a year, but at least points to the prospects for a quick start to recovery. At least the direction of movement causes moderate optimism. True, this happened in many respects only at the expense of Germany, where the index of business activity in the manufacturing sector grew from 45.3 to 48.0, while they expected growth only to 47.8. France also contributed, where the business activity index, although dropped from 51.1 to 49.8, was still better than the forecast of 49.7. Spain showed unexpectedly good results, the index of business activity in the manufacturing sector of which grew from 48.5 to 50.4. Predicted growth to 49.1. But the contribution of Spain is much less than not only Germany or France, but also Italy, the index of business activity in the manufacturing sector of which fell from 48.9 to 48.7. The essence of the matter lies also in the fact that they expected the index to rise to 49.5 in Italy. In the bottom line, we see a slightly more positive dynamics of sentiment in the industrial sector of Europe, which was the reason for the strengthening of the single European currency during the European session.
Manufacturing PMI (Europe):
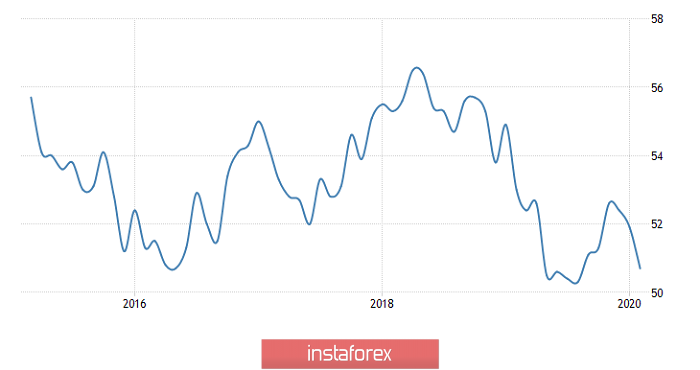
US data also supported the euro's growth, which, as you might guess, were rather weak. Of course, everyone was waiting for the decline in the index of business activity in the manufacturing sector Markit, but still not to 50.7, but only from 51.9 to 50.8. Moreover, a similar index from ISM showed a decrease from 50.9 to 50.1, with a forecast of 50.2. In other words, the prospects for the restoration of industry seem rather illusive, since the industry itself does not particularly believe in it, and rather sees signs of a worsening situation. Of course, against this background, construction costs look rather strange, which increased not by 0.5%, but by 1.8%. After all, they are very specific about the possible growth of industry. But we must admit that the contribution of construction to industry is not so significant.
Manufacturing PMI (United States):
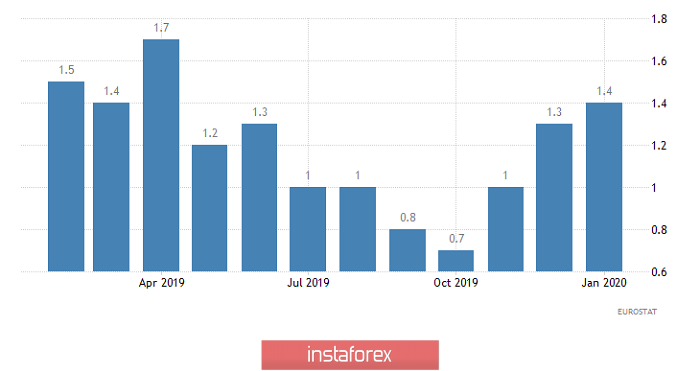
Today, all attention is only on Europe, where preliminary inflation data are published. Moreover, data will not be released in the United States. So, inflation in Europe should decrease from 1.4% to 1.3%. Which in itself does not cause any joy. But more importantly, recent data on the largest countries in the euro area are more likely to indicate that the decline in inflation will turn out to be somewhat more significant, and a value of 1.2% does not seem so fantastic. Well, this clearly indicates that the recently born hopes for the prospects of tightening the monetary policy of the European Central Bank turned out to be premature. And the fact of inflation reduction should be the beginning of the reverse movement of the single European currency.
Inflation (Europe):
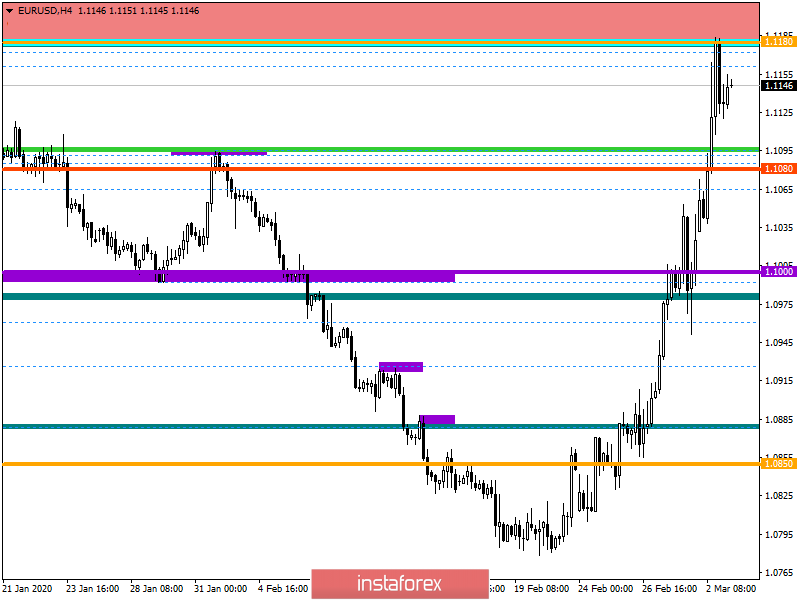
From the point of view of technical analysis, we see that the start of the new week was in the same inertial phase as the days earlier, where as a result the quote went above the levels of 1.1080-1.1150. In fact, we have such a strong overheating of long positions that it does not seem logical to maintain the set heights, which can provoke a surge in speculative interest.
In terms of a general review of the trading chart, we see that the February downward movement was 100% worked out, and the speed of this movement was twice as high as during the decrease.
It is likely to assume that an overbought signal has already been received, now the main task is to identify the resistance point. Presumably, the 1.1180/1.1230 region can play this role if we refer to the slowdowns a period earlier, where the quote systematically found the resistance level. The recovery process, relative to the inertial stroke, can easily return the quote to the values of 1.1080/1.1000, within a few days.
From the point of view of a comprehensive indicator analysis, we see that technical instruments unanimously signal purchases due to a strong inertial move. It is worth considering that when a correction occurs, the indicators at the minute and hour intervals will quickly change their values.