Bitcoin was moving confidently along a narrow range of $60k- $63.5k and was approaching the final stage of its bullish breakout. However, life itself intervened in the form of fundamental factors that provoked a fall in the price of the coin to the support level of $60k, where quotes began to recover. This event indicates that BTC will again begin to consolidate in the area soon and only then will it resume a bullish rally. However, before starting a technical analysis, it is worth examining the reason for the fall in the price of the cryptocurrency.
The determining factor that negatively influenced the movement of the coin's price was the results of the Fed meeting, where the fate of the US monetary policy is decided. The members of the Federal Reserve have come to the conclusion that at the end of November a program will be launched to taper the emergency stimulus. The volume of infusions will decrease by $15 billion every month. This means that there will be less paper money in circulation, and, consequently, the rate of inflation will slow down significantly. Namely, the depreciation of fiat currencies is the main reason for the growth of BTC quotes due to the desire of large investors to protect their funds from inflation.
Taking into account this news, the price of BTC sank by $3,000 per hour and subsequently recovered in the range of fluctuations of $61.5k- $63.5k. It is extremely important for any investor to maintain a calendar of major events in order to avoid illogical impulse price movements in the market.
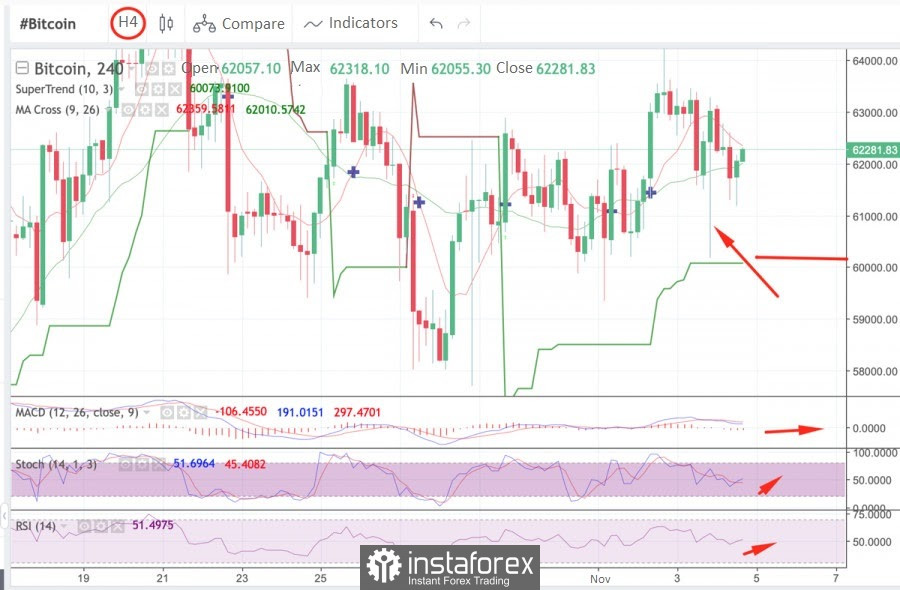
Later, the bears again seized the initiative and reduced the price to the lower border of the fluctuation range. Judging by the dynamics of the last hours, buyers again seize the initiative and continue to push the price to the upper border of the region. This is also indicated by technical indicators.: MACD is moving sideways, but with preconditions for the formation of a bullish crossover and the start of an upward movement. At the same time, the stochastic oscillator has formed a bullish crossover and tends to the 70 mark, while the relative strength index has long been in the upward zone.

On the hourly chart, bulls are also taking over and triggering an upward trend, even though the asset is trading below the supertrend line. The price is trying to gain a foothold above $62k, where the line of increased selling pressure passes. Despite this, the technical indicators of the crypto on the hourly timeframe show a confident upward trend, which suggests that the strength of the medium-term trend is developing more slowly than the short-term one. MACD is completing the formation of a bullish crossover, and the stochastic oscillator has crossed the 50 mark, which indicates an increase in purchases and a desire to move to the upper border of the range.
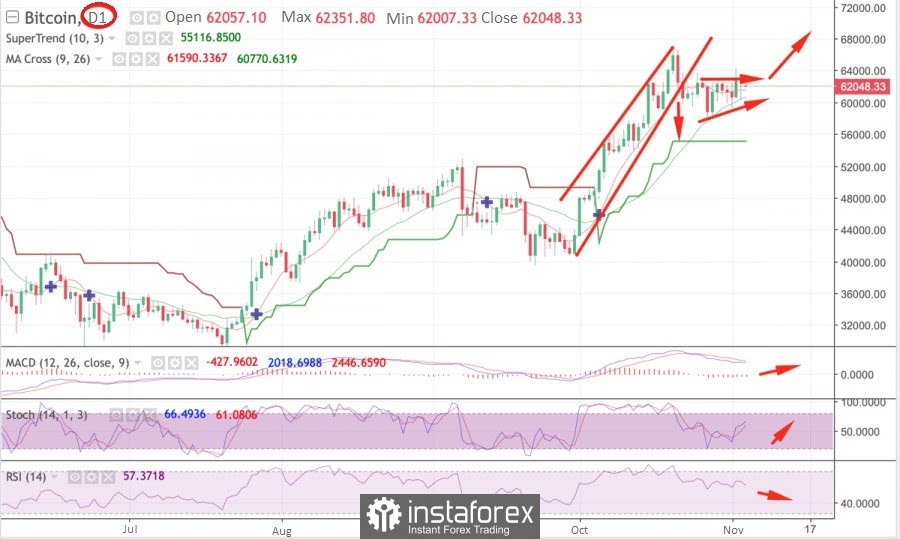
Doji candlestick has formed on the daily chart, which indicates an uncertain price movement. However, it should be borne in mind that in this case, the appearance of such a pattern indicates a rebound in quotes from the support zone at $60k after the results of the Fed meeting.
There is nothing strange about the current state of the BTC price, as the asset continues to move sideways, consolidating the price. It is not recommended to trade in such a range, only if, according to a broader analysis, quotes move from the upper to the lower border of the range.
The current area of Bitcoin price movement is between $58.7k- $62.7k, and judging by the uncertainty of bulls and bears, the period of stabilization will continue. The technical indicators of the coin also signal this: MACD is moving sideways, and the relative strength index began to decline past the 40 mark, which indicates a lack of impulse to buy and pressure on the price from buyers. Stochastic continues its upward movement, but will soon form a bearish crossover, which will mean the final loss of the medium-term upward momentum.