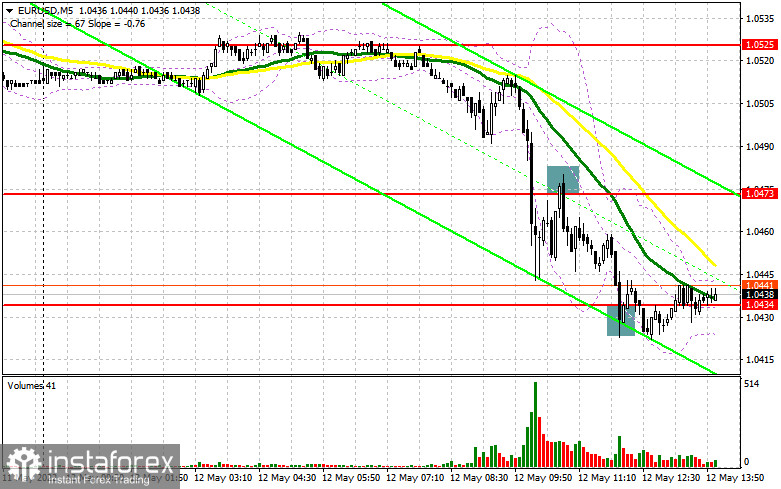
In the morning article, I highlighted the level of 1.0473 and recommended taking decisions with this level in focus. Now let's look at the 5-minute chart and try to figure out what actually happened. Bears managed to push the euro to 1.0473 because of the weak market reaction to Christine Lagarde's speech and the empty economic calendar. I advised traders to sell the euro in case of an upward test of this level. Everything unfolded according to the scenario. It brought about 40 pips of profit. After a downward test of 1.0473, the pair decreased to the support level of 1.0434. Bulls tried to regain control of this level. A buy signal appeared amid a false breakout of the given level. However, so far, this signal has had little effect on trading. Judging by technical indicators, the pivot levels changed slightly for the afternoon trading.
What is needed to open long positions on EUR/USD
Today, traders are anticipating the producer price index data. The figure is unlikely to coincide with expectations. If the reading rises as many economists have forecast, demand for risky assets will fall even more. It is recommended to open short positions on EUR/USD as the likelihood of a rise to the support level of 1.0429 is low. If the report shows a slowdown in produce prices, then the euro may advance slightly. However, bulls are too weak to push the pair out of the downward channel, especially ahead of Fed members' speeches. As long as the pair is trading above 1.0434, you may keep your positions open counting on a breakout of 1.0478. A new buy signal on the euro will only appear after a false breakout near the support level of 1.0429. This will give a good entry point into long positions, signaling a rise in demand among big retail traders. As I noted above, the pair may break through 1.0478. If it climbs above this level provided that Fed policymakers' speeches will not contain anything new. Mary Daly will give a speech immediately after the publication of the producer price index. A breakout and a downward test of 1.0478 may give a new buy signal. Bulls could take the upper hand. EUR/USD may reach 1.0525. I recommend locking in profits at this level. The moving averages are passing in the negative zone at this level. A more distant target level will be1.0575. If EUR/USD declines and bulls show now activity at 1.0429, which is highly likely, the optimal scenario for long positions will be a false breakout near a yearly low of 1.0389. It is better to open long positions on the euro immediately for a rebound only from 1.0347 or even a lower low around 1.0312, keeping in mind an upward intraday correction of 30-35 pips.
What is needed to open short positions on EUR/USD
Bears managed to push the euro to the new lows. As a result, the pair escaped the sideways channel. The primary task of the bears for the second half of the day will be a breakout and consolidation of the pair below the nearest support level of 1.0429. An upward test of this level, similar to the one I mentioned above, and a strong increase in the PPI index will generate an additional sell signal with the prospect of a further drop to new swing lows around 1.0389 and 1.0347. I recommend locking in profits at these levels. If Fed members make hawkish comments and weak EU economic reports, the pair may take a nosedive to 1.0312 in the near future. If EUR/USD climbs after the PPI data, the optimal scenario for opening short positions will be a false breakout of 1.0478. Yet, we should wait until the price hits this level again. If bears show no energy at 1.0478, an upward reversal is possible. It is better to open short positions after a false breakout of 1.0525. You can sell EUR/USD immediately on a rebound from 1.0575, keeping in mind a downward intraday correction of 25-30 pips.
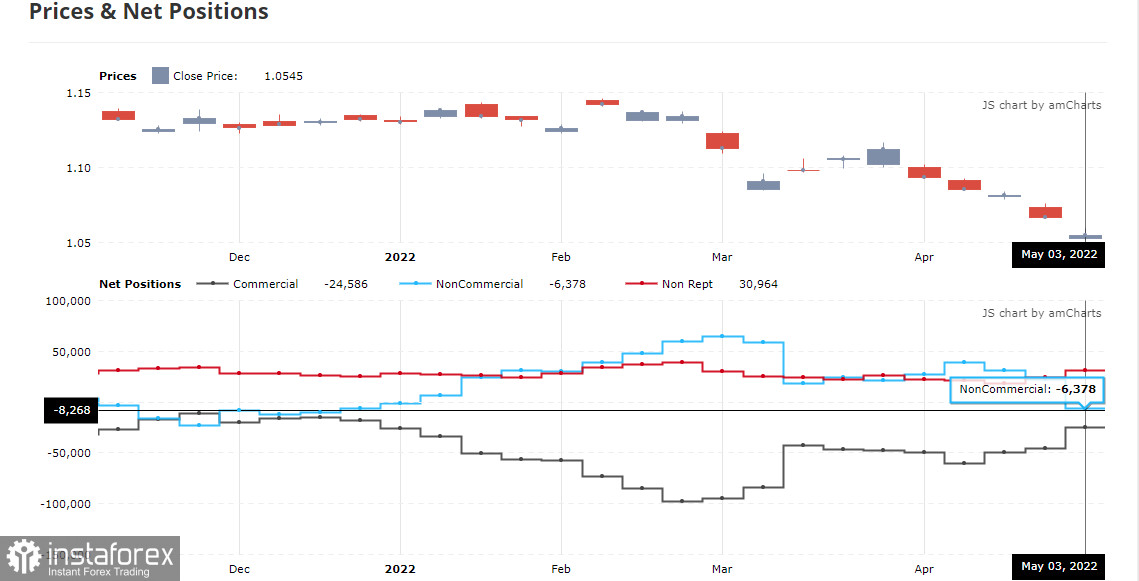
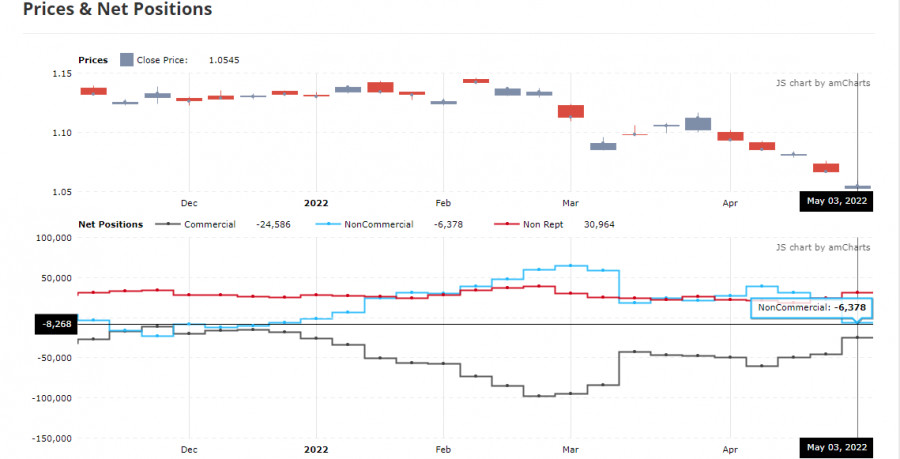
COT report (Commitment of Traders) for May 3 logged a sharp rise in short positions and a drop in long ones. After the speeches of policymakers of the main central banks, traders began to get rid of risky assets. They are now well aware that developed countries may soon face serious economic challenges. Investors are prone to seek shelter in the US dollar as a safe-haven asset as the Fed plans to hike rates by 50 basis points. The US is not the only country dealing with soaring inflation. For this reason, central banks worldwide are now gradually shifting to a tightening monetary policy cycle. It also fuels demand for the US currency. ECB President Christine Lagarde has repeatedly stressed the need for a more hawkish stance on monetary policy in her speeches. The ECM is likely to complete its asset purchase program by the end of the second quarter of this year. The first rate increase may occur in the fall of this year. While the ECB voices plans for the future, the Fed takes decisive actions. It is quite bullish for the US dollar. The Fed is now guided by inflation figures. If the report shows a slight decline, the pressure on the euro will weaken. It may lead to the strengthening of risky assets. The pair could even start a small upward correction. The COT report revealed that the number of long non-commercial positions decreased to 208,449 from 221,003, while the number of short non-commercial positions jumped to 214,827 from 189,702. Notably, a cheaper euro is more attractive to traders. So, even in case of a drastic decline, the euro will be quite attractive for medium-term investors. At the end of the week, the total non-commercial net position amounted to 6,378. The weekly closing price totaled 1.0545 against 1.0667.
Signals of technical indicators
Moving averages
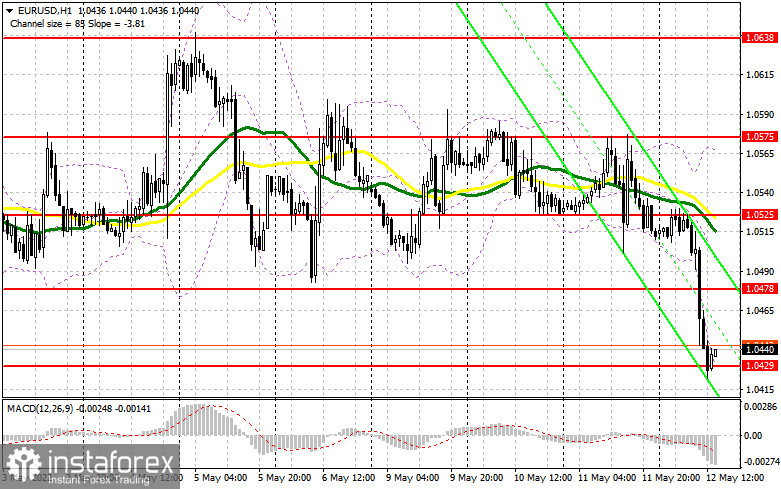
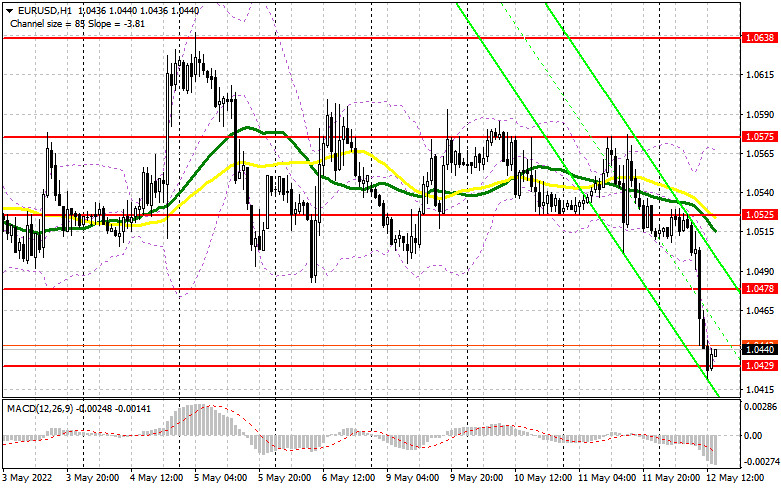
EUR/USD is trading below 30- and 50-period moving averages. It indicates that the bearish sentiment is strong.
Remark. The author is analyzing the period and prices of moving averages on the 1-hour chart. So, it differs from the common definition of classic daily moving averages on the daily chart.
Bollinger Bands
In case of a rise, the upper border of the indicator around 1.0575 will act as resistance.
Definitions of technical indicators
- Moving average recognizes an ongoing trend through leveling out volatility and market noise. A 50-period moving average is plotted yellow on the chart.
- Moving average identifies an ongoing trend through leveling out volatility and market noise. A 30-period moving average is displayed as the green line.
- MACD indicator represents a relationship between two moving averages that is a ratio of Moving Average Convergence/Divergence. The
- MACD is calculated by subtracting the 26-period Exponential Moving Average (EMA) from the 12-period EMA. A 9-day EMA of the MACD called the "signal
- line".
- Bollinger Bands is a momentum indicator. The upper and lower bands are typically 2 standard deviations +/- from a 20-day simple moving average.
- Non-commercial traders - speculators such as retail traders, hedge funds, and large institutions who use the futures market for speculative purposes and meet certain requirements.
- Non-commercial long positions represent the total long open position of non-commercial traders.
- Non-commercial short positions represent the total short open position of non-commercial traders.
- The overall non-commercial net position balance is the difference between short and long positions of non-commercial traders.