To open long positions on EUR/USD, you need:
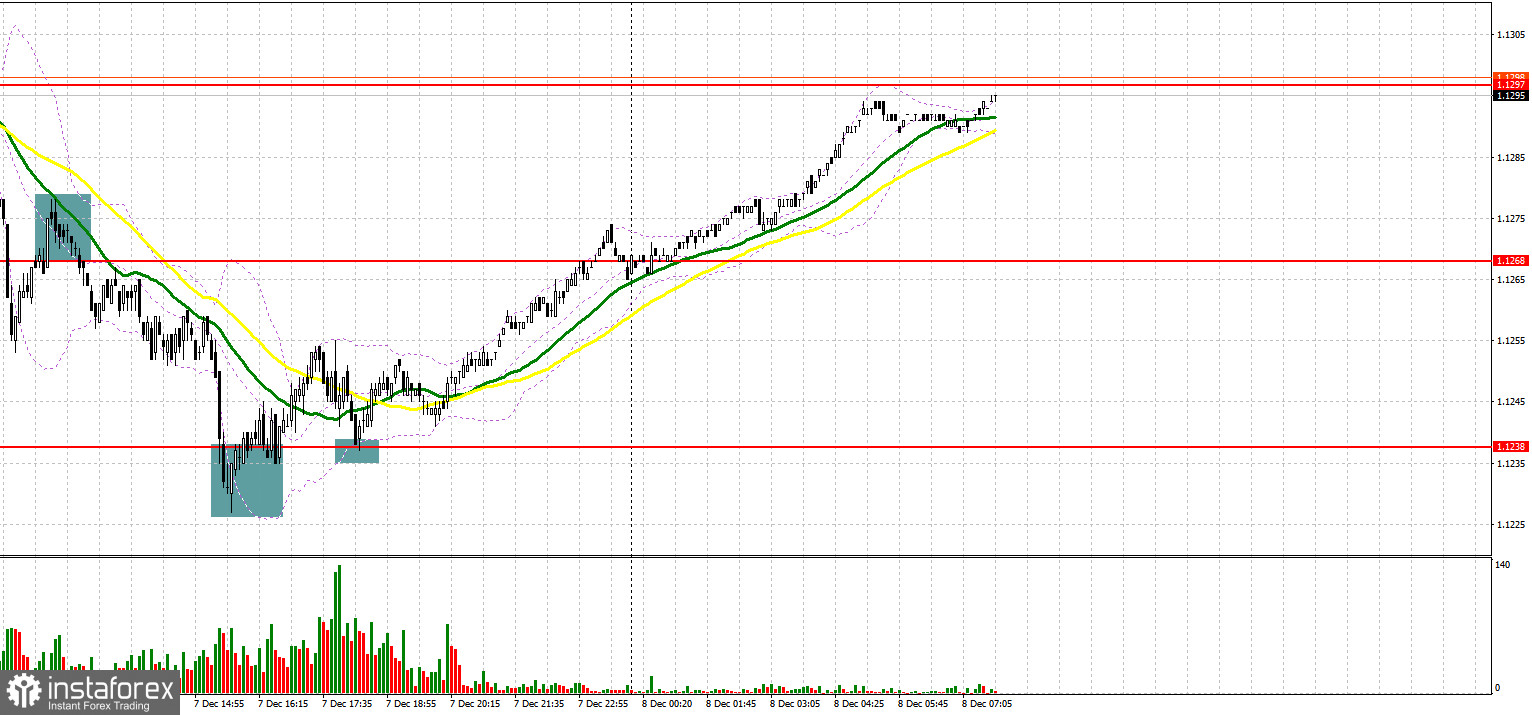
Yesterday there were some good signals to enter the market. I suggest looking at the 5-minute chart and sorting out the trades. In my morning forecast, I paid attention to the 1.1268 level and advised you to make decisions on entering the market. Comprehensive statistics from the ZEW Institute on the index of business sentiment in Germany and the eurozone, as expected, put pressure on the euro, resulting in a breakthrough and consolidation below 1.1268. A reverse test of this level led to the formation of a sell signal, as a result of which the pair fell by more than 40 points, renewing support at 1.1238. In the afternoon, the bulls took advantage of the lack of activity below 1.1238 and brought the pair back to this level. Its test from top to bottom, and I indicated such a probability in my forecast for the US session, led to the formation of a buy signal. As a result, the euro returned back to 1.1268, which made it possible to take about 30 more points from the market.
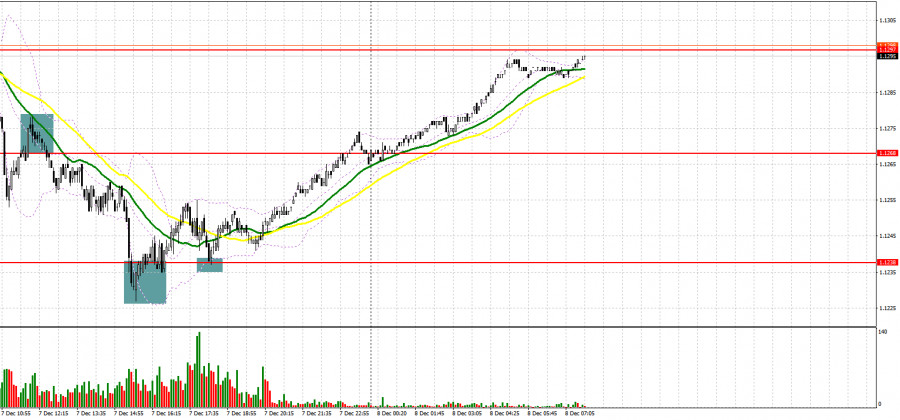
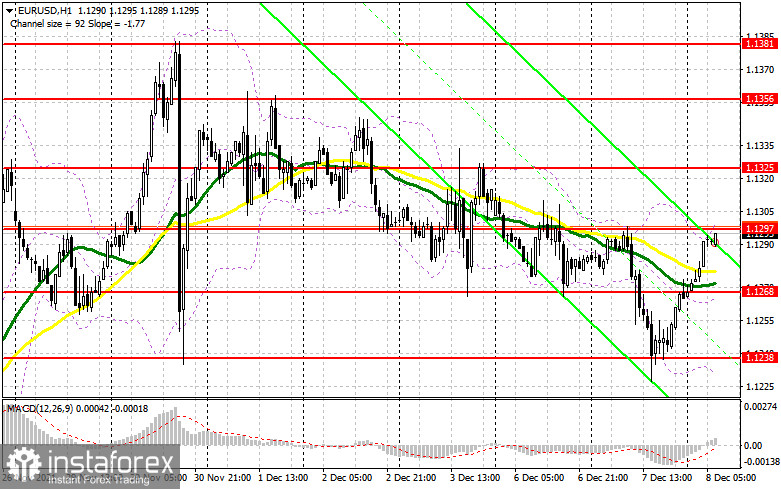
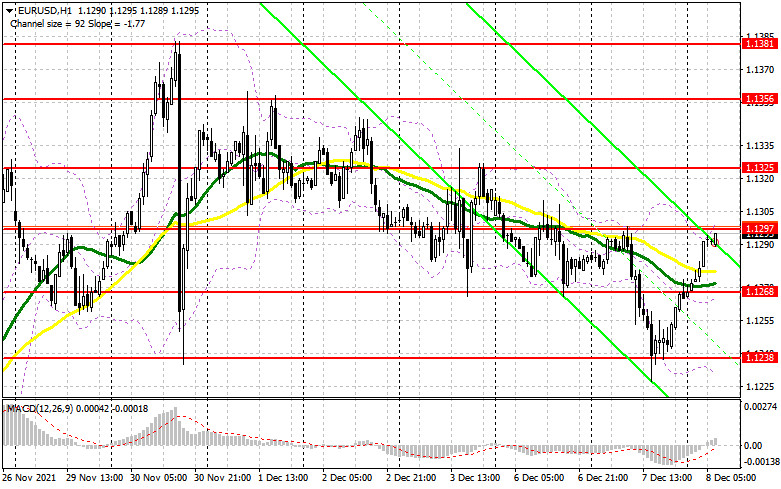
Despite the rather high volatility of the pair, the technical picture has not changed in any way compared to yesterday. Today there are no important fundamental statistics on the euro area and only a number of representatives of the European Central Bank are speaking. If the statements of ECB President Christine Lagarde and ECB Vice President Luis de Guindos are hawkish, demand for the euro may persist. This will lead to a breakthrough and consolidation above 1.1297. The test of this level from top to bottom will provide an excellent entry point into buying the euro with the goal of returning to the area of the upper border of the horizontal channel at 1.1325, which we did not manage to get above last Friday. A breakthrough of this range too will lead to a larger upward correction to the area of the weekly high of 1.1356, where I recommend taking profits. The next target will be the 1.1381 level. If the pressure on the euro returns in the first half of the day, and bulls, like yesterday, will not be able to offer anything at 1.1297, it is best not to rush into long positions, but wait for the test of 1.1268. Only the formation of a false breakout there will provide a good entry point into long positions. If the bulls are not active at this level, it is best to postpone selling until the larger support at 1.1238. I advise you to buy EUR/USD immediately on a rebound from the 1.1214 low, or even lower - around 1.1188 while aiming for an upward correction of 20-25 points within the day.
To open short positions on EUR/USD, you need:
The main task for the euro bears is to protect 1.1297. Formation of a false breakout there, together with softer statements from the ECB about future monetary policy, will provide an excellent entry point into short positions with expectations of maintaining the bearish momentum observed yesterday. News about the new Omicron strain affects the markets less and less, so only a serious aggravation of the situation with its distribution will be able to put pressure on the euro. An equally important task for the EUR/USD bears is to regain control of the 1.1268 support. You can act by analogy with yesterday: the breakthrough and test from the bottom up of 1.1268 will lead to forming a signal to open short positions with the prospect of a decline to the 1.1238 area. The next target will be the support at 1.1188, where I recommend taking profits. If the euro grows and the bears are not active at 1.1297, it is better to wait with short positions. The optimal scenario will be short positions when a false breakout is formed around 1.1325. You can open short positions immediately on a rebound from the highs: 1.1356 and 1.1381 while aiming for a downward correction of 15-20 points.
I recommend for review:
The Commitment of Traders (COT) report for November 30 revealed a decrease in both short and long positions. However, the reduction of long positions still remained higher, which led to an increase in the negative delta. Last week there were a lot of speeches by Federal Reserve Chairman Jerome Powell, who in his comments spoke enough about the expected changes in monetary policy towards its tightening. The reason for this is rather high inflation, which has grown from "temporary" to permanent, which creates many problems for the central bank. The second problem was a new strain of the Omicron coronavirus, which will slow down the global economy at the end of this and early next year, which also restrains the demand for risky assets from bulls. The Fed will hold a meeting next week, at which a decision will be made on the bond purchase program, so demand for the US dollar is expected to remain in the shorter term. The latest November COT report indicated that long non-commercial positions declined from the level of 204,214 to the level of 191,048, while short non-commercial positions fell from the level of 220,666 to the level of 214,288. At the end of the week, the total non-commercial net position increased to -23,240 against -16,452. The weekly closing price, on the contrary, rose much to 1.1292 against 1.1241.
Indicator signals:
Trading is carried out slightly above 30 and 50 daily moving averages, which indicates serious activity of euro bulls, who managed to win back all of yesterday's fall.
Moving averages
Note: The period and prices of moving averages are considered by the author on the H1 hourly chart and differs from the general definition of the classic daily moving averages on the daily D1 chart.
Bollinger Bands
A breakthrough of the upper border of the indicator in the area of 1.1297 will lead to a new wave of euro growth. In case of a decline, support will be provided by the lower border of the indicator in the area of 1.1230.
Description of indicators
- Moving average (moving average, determines the current trend by smoothing out volatility and noise). Period 50. It is marked in yellow on the chart.
- Moving average (moving average, determines the current trend by smoothing out volatility and noise). Period 30. It is marked in green on the chart.
- MACD indicator (Moving Average Convergence/Divergence — convergence/divergence of moving averages) Quick EMA period 12. Slow EMA period to 26. SMA period 9
- Bollinger Bands (Bollinger Bands). Period 20
- Non-commercial speculative traders, such as individual traders, hedge funds, and large institutions that use the futures market for speculative purposes and meet certain requirements.
- Long non-commercial positions represent the total long open position of non-commercial traders.
- Short non-commercial positions represent the total short open position of non-commercial traders.
- Total non-commercial net position is the difference between short and long positions of non-commercial traders.