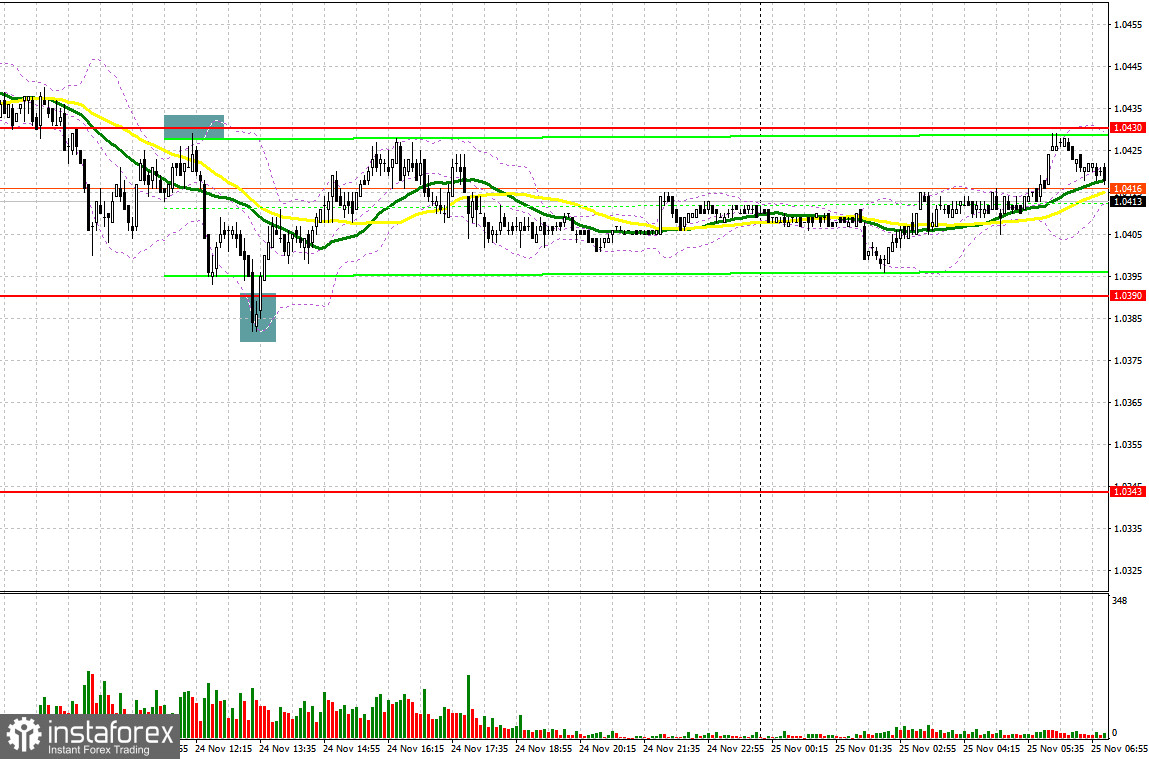
Yesterday, a few significant entry signals were made. Let's take a look at the M5 chart to get a picture of what happened. In the previous review, we focused on the mark of 1.0430 where we considered entering the market. A breakout and a retest of this lever to the upside following the release of mixed data in Germany generated a buy signal. At the moment of writing, the price fell by over 30 pips. During the North American session, the bulls managed to protect 1.0390 support. A false breakout occured and a buy signal was generated. The quote advanced by about 40 pips.
When to go long on EUR/USD:
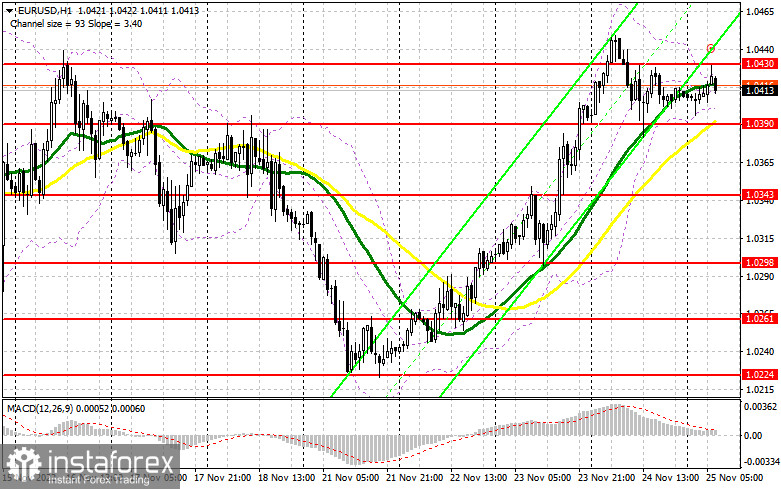
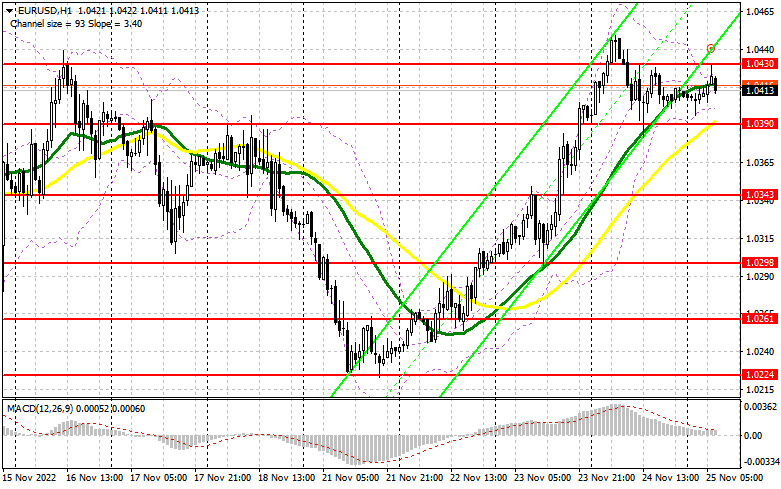
Yesterday, the lack of macro releases and the celebration of Thanksgiving Day in the US affected trading volumes, so the pair moved in the sideways channel. Germany's Q3 statistics due today may influence the euro. If the Gfk consumer climate figures come better than expected, the euro will stay firm at its current levels. The speech of Kerstin af Jochnick, a Member of the Supervisory Board of the ECB, is unlikely to affect the pair somehow. Therefore, it would be wiser to trade within the sideways channel. The pressure on the euro will increase in case of disappointing results in the eurozone. A false breakout through the nearest support of 1.0390 will confirm the presence of major players in the market who bet on further growth, and the pair will return to 1.0430 resistance. In the event of a breakout and a test of this range to the downside, EUR/USD may head toward 1.0475 and 1.0525. Above this range, there is a mark of 1.0568. A breakout of this mark will trigger a row of bearish stop orders and generate an additional buy signal with the target at 1.0604 where a profit-taking stage may begin. In such a case, the uptrend will get stronger. If EUR/USD goes down when there is no bullish activity at 1.0390, the pressure on the euro will soar. A breakout through 1.0390 will lead to the pair's fall to 1.0343 support where long positions could be considered after a false breakout. Also, it will be possible to buy EUR/USD immediately after a bounce off 1.0298, which is in line with the bullish moving averages, or even lower, in the area of 1.0261, allowing a bullish correction of 30-35 pips intraday.
When to go short on EUR/USD:
Clearly, the bears did everything they could. Now it remains to be seen whether the bulls will be able to go above 1.0430. In the first half of the day, a false break at 1.0430 will create an excellent entry point pushing the euro back toward the 1.0390 support, in line with the bullish moving averages. Consolidation below this range may cause an increase in the pressure on the euro on Friday and trigger a significant bearish correction. This scenario will play out if macro data for Germany turns out to be disappointing. A retest of the 1.0390 level to the upside will make a sell signal and trigger a row of bullish stop orders, and the pair will fall to 1.0343 where bullish activity may increase. The most distant target is seen in the area of 1.0298where a profit-taking stage may begin. If EUR/USD goes up during the European session when there is no bearish activity at 1.0430, demand for the pair will increase. In such a case, we may expect a continuation of the bull market and a test of the 1.0475 mark. In the second half of the day, trading volumes will be quite low and there will be no one to buy the euro above monthly highs because of a day off. In such a case, it would be wiser to go short at 1.0475 after a false breakout only. Also, it will be possible to sell EUR/USD immediately after a bounce off the 1.0525 high, or even higher, at 1.0568, allowing a bearish correction of 30-35 pips.
Commitments of Traders:
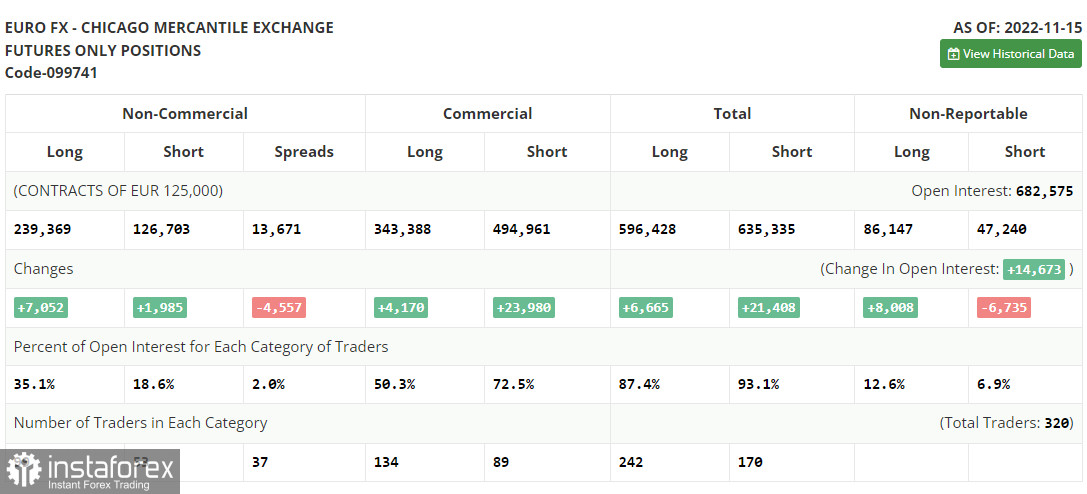
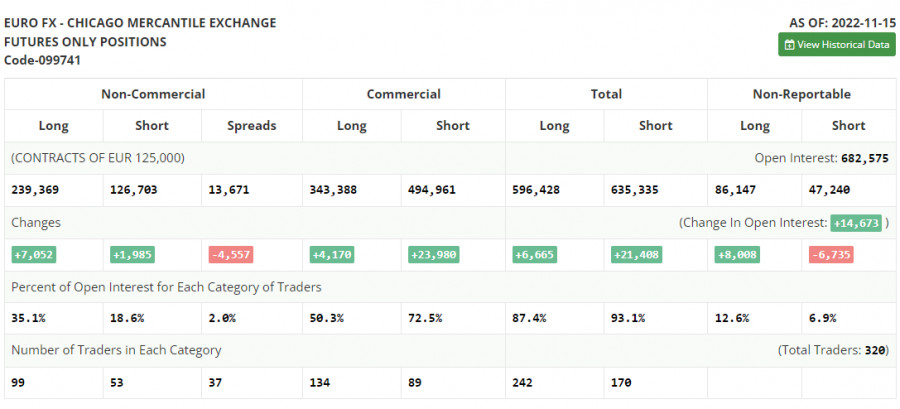
The COT report from November 15 logged an increase in both short and long positions. There has been growing speculation lately on the Fed's less-aggressive stance on monetary tightening which could be announced in December. However, such assumptions contradict the latest US retail sales data for October, which came better than expected, proving high inflationary pressure at the year-end. For this reason, the recent US inflation report should be treated cautiously as the CPI indicated easing inflationary pressure. Apparently, the Federal Reserve will stick to its hawkish agenda, going ahead with sharp rate hikes. When it comes to the euro, demand for risky assets has grown a bit. Nevertheless, following the latest EU statistics, especially GDP, the pair is unlikely to show another explosive jump by the year-end. According to the COT report, long non-commercial positions rose by 7,052 to 239,369 and short non-commercial positions increased by 1,985 to 126,703. The total non-commercial net positions remained positive at 112,666 last week versus 107,599 a week ago. In other words, investors keep taking advantage of the situation and buying the undervalued euro even above the parity level. Traders are accumulating long positions, hoping for a resolution to the crisis and betting on a stronger euro in the long term. The weekly closing price rose to 1.0390 versus 1.0104.
Indicator signals:
Moving averages
Trading is carried out above the 30-day and 50-day moving averages, a continuing recovery in the euro.
Note: The period and prices of moving averages are viewed by the author on the hourly chart and differ from the general definition of classic daily moving averages on the daily chart.
Bollinger Bands
The lower band at 1.0390 stands as support. Resistance is seen at 1.0430 in line with the upper band.
Indicator description:
- Moving average (MA) determines the current trend by smoothing volatility and noise. Period 50. Colored yellow on the chart.
- Moving average (MA) determines the current trend by smoothing volatility and noise. Period 30. Colored green on the chart.
- Moving Average Convergence/Divergence (MACD). Fast EMA 12. Slow EMA 26. SMA 9.
- Bollinger Bands. Period 20
- Non-commercial traders are speculators such as individual traders, hedge funds, and large institutions who use the futures market for speculative purposes and meet certain requirements.
- Long non-commercial positions are the total long position of non-commercial traders.
- Non-commercial short positions are the total short position of non-commercial traders.
- Total non-commercial net position is the difference between the short and long positions of non-commercial traders.