GBP/USD 24H
Unlike EUR/USD, GBP/USD is not trading in the flat market. Moreover, the sterling seems to take a nosedive in the nearest days. Following a slump on September 1, the currency pair has rebounded exactly 61.8%. To sum it up, the odds are that GBP/USD will resume a downtrend in the short term. Oddly enough, the reinforcement of the sterling in the past few weeks confounds the fundamental background. The UK is dealing with challenging foreign politics, economic picture, and the COVID-19 resurgence. So, the logical development would be a slump of GBP/USD.
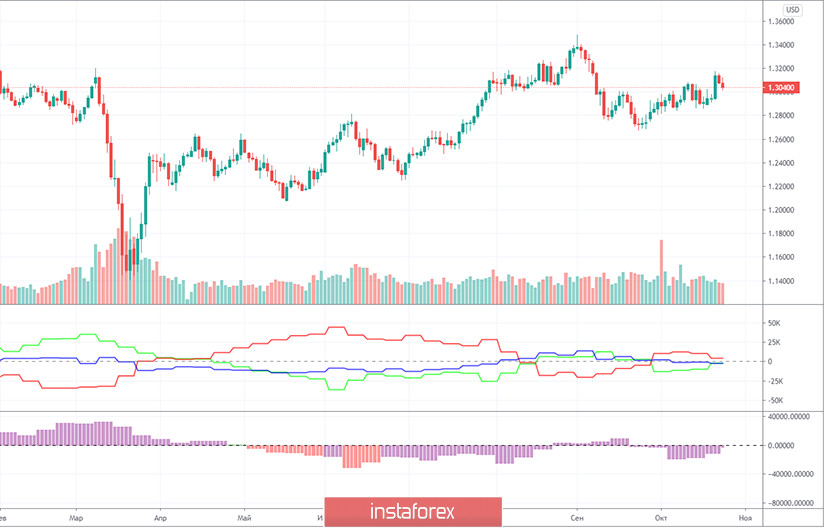
COT report
A new COT (Commitments of traders report) showed that non-commercial traders were speculating the sterling robustly on the week of October 13-19. At the same time, several COT reports baffled market sentiment on GBP. Last week, the non-commercial group opened 4,485 buy contracts and closed 4,072 sell contracts. Thus, the net position of professional traders instantly surged by 8,500 contracts that proves active trading activity. The problem is that over a few past weeks, non-commercial traders increased the buy net position, thus boosting bullish sentiment, but over a few weeks before that they had decreased the net position. In other words, professional traders have been puzzled about a trajectory of GBP/USD for a few months. No wonder, they are at a loss amid the fundamental background. Last week, the pound sterling dropped almost 110 pips. Net positions of both commercial and non-commercial traders equal nearly zero at present. It means that both groups of market players keep open roughly the same number of buy and sell contracts. Of course, such data of COT reports confuses traders with both short- and long-term forecasts.
The fundamental background of GBP/USD is determined by few factors: Brexit, the talks between London and Brussels on the trade deal, and the presidential election in the US. So, reinforcement of the sterling can be explained by the lack of negative news from the UK. Nevertheless, the overall picture in Great Britain remains challenging. In essence, Brussels and London could announce the termination of the talks because the gridlock cannot be solved. Personally, I reckon that the talks are likely to continue until the sides come to some agreement, though it might take much longer time than expected. Meanwhile, the deadline for the trade deal is set for December 31. Obviously, the sides will hardly make the deal until December 31. Everyone understands it. So, from my viewpoint, the pound sterling will inevitably tumble again sooner or later. Nowadays, the sterling is keeping afloat amid political jitters in the US and uncertain outcome of the election. However, after the election (I'd like to believe that uncertainty will not linger for weeks or months), the situation will clear up, thus releasing the pressure from dollar bulls. Once, I told you the list of factors why the pound sterling is doomed to failure next year. Therefore, the sterling is expected to follow the long-term downtrend that began back in 2007 and resurfaced in 2014.
Trading plan for week of October 26-30
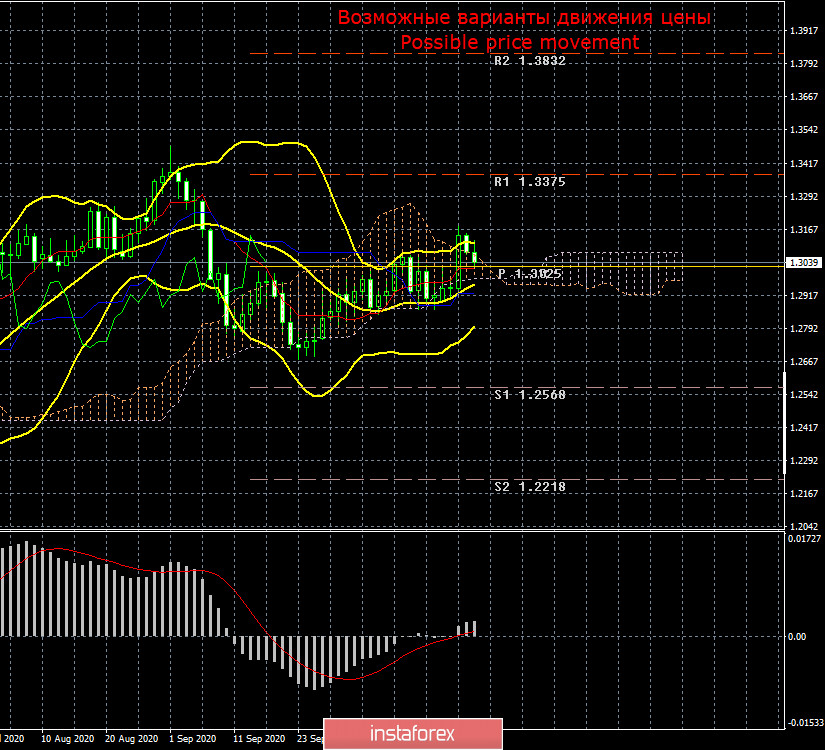
1)The buyers are exhausting strength to push the pair up. So, GBP/USD could reverse downwards in the nearest future. It is still possible to buy the pair on minor time frames as long as the price is staying above the crucial Kijun-sen line. Please beware that the current fundamental background makes any long bets too risky.
2)The sellers have more power to insist on the bearish trend. They need to push the price below the Senkou Span B line (1.2980) and the Kijun-sen line (1.2923) on the 24-hour time frame. In this case, the likelihood of a new nosedive will increase notably. The first target is seen at 1.2568.
Notes for the pictures
The resistance/support levels are the target levels when opening long/short positions. You can place take profit levels next to them.
Indicators Ishimoku, Bollinger bands, MACD
Areas of support and resistance are the ones from where the price has rebounded or has been rejected a few times.
Indicator 1 in the COT charts is a size of net positions for each category of traders.
Indicator 2 in the COT charts is a size of net positions for the non-commercial group.