What is needed to open long positions on GBP/USD
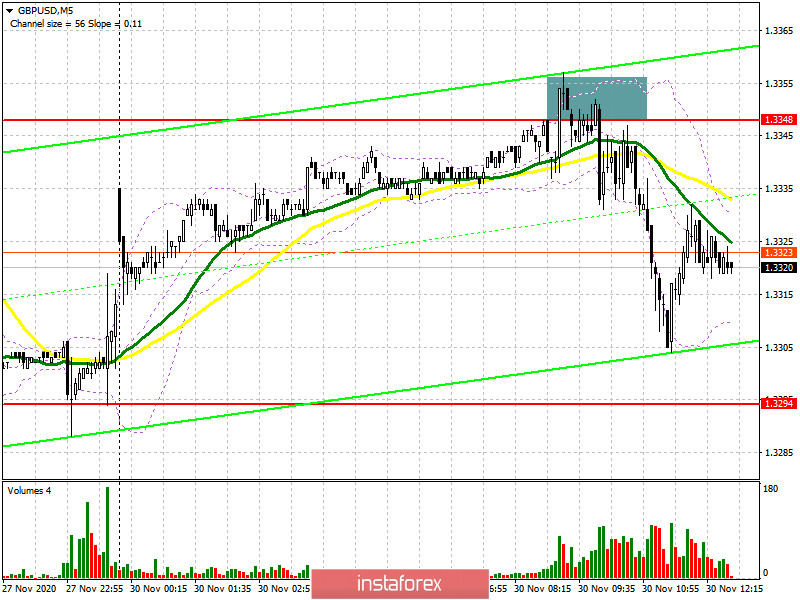
In the morning forecast, I recommended opening short positions upon a formation of a fake breakout in the resistance zone of 1.3348. That's what actually has happened. If we look at the 5-minute chart, we'll see that the bulls made an effort to push the price above 1.3348 which is the middle line of the trading range. However, their efforts were in vain. Later, the price formed a fake breakout (I highlight the area above the fake breakout). Then, while 1.3348 was tested from bottom to top, the chart generated a sell signal. The first price action downwards brought about 40 pips. However, the bears haven't reached the main target yet.
The technical picture remains the same, though the sellers are still holding the upper hand in the market. The bulls aim to control resistance of 1.3348. Indeed, only in case the price is fixed above this level and is test downwards, this opened the door for further long deals on GBP/USD. The second test of this trading range could enable a breakout of this level. In this case, 1.3395 will serve as a target and the upper border of the trading range. GBP/USD was trading exactly in this range for the whole last week. Only a breakout and good Brexit news will trigger a new bullish wave towards 1.3453 and 1.3509 where I recommend profit taking. Under the scenario of the pound's decline in the second half of the trading day, the bulls will try to defend support of 1.3294 that's what is going on now. This support is the lower border of the trading range. Please beware there is a little hope for this scenario. A signal for opening long deals is expected only a fake breakout is formed there.
If the price action is muted in this range, it would be better to cancel long deals until a new low is made at near 1.3294. Otherwise, we can buy GBP/USD immediately during a bounce from 1.3194 bearing in mind a 20-30 pips upward intraday correction.
What is needed to open short deals on GBP/USD
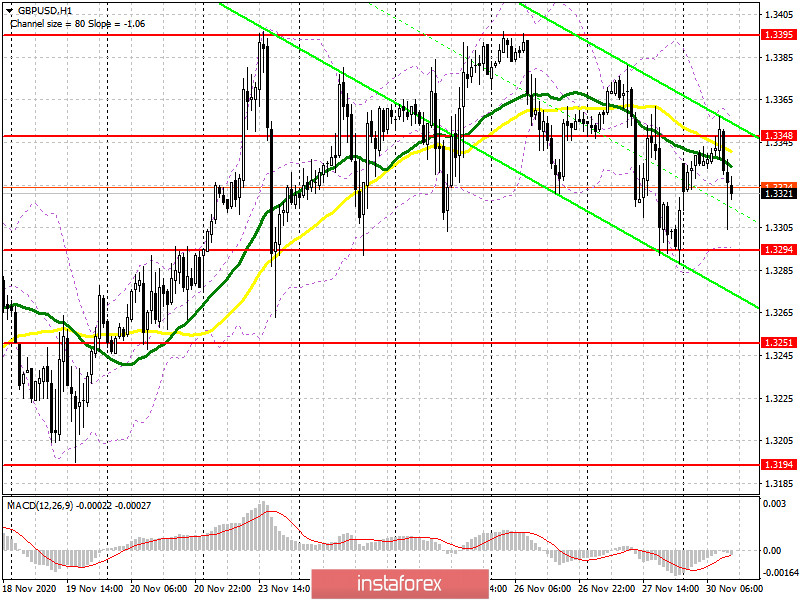
The sellers coped well with the morning task and managed to defend resistance at 1.3348 where the price formed a sell signal. As long as the currency pair is trading below this trading range, I expect a further slide towards 1.3294. If the price is fixed there, the market will see sell-offs of GBP/USD towards 1.3251 where I recommend profit taking. A deeper bearish target is 1.3194. In case the bears are not active in the American pre-market, GBP/USD could again rebound to resistance of 1.3348. Under this scenario, I would recommend short positions only after a formation of a fake breakout.
If a fake breakout is not formed, the bulls could push the price above 1.3348. So, it would be better to cancel selling until the upper border of the trading range at 1.3395 is tested. Besides, a higher high could pose a danger to the ongoing downtrend. We can sell from there only upon the first test immediately during a bounce bearing in mind a 20-25 intraday correction. We can consider larger buying after the price makes a higher high of 1.3453.
Let me remind you that the Commitment of Traders report for November 17 revealed fewer short positions and a sharp increase in short positions. Long non-commercial positions decreased from 27,872 to 27,454. At the same time, the volume of short non-commercial positions rose to 47,200 from 45,567. As a result, the negative non-commercial net positions came in at -19,746 against -17,695 a week earlier. This indicates that GBP/USD sellers are setting the tone in the market. The bulls lack confidence due to uncertainty in the trade deal between London and Brussels and a lockdown in the UK economy in November.
Signals of technical indicators
Moving averages
The pair is trading at about 30- and 50-period moving averages. It indicates a range-bound manner of trading.
Remark. The author is analyzing a period and prices of moving averages on the 1-hour chart. So, it differs from the common definition of classic daily moving averages on the daily chart.
Bollinger Bands
A breakout of the lower border of the indicator will entail a new bearish wave. Alternatively, a breakout of the upper border at 1.3355 will form another round of the uptrend.
Definitions of technical indicators
- Moving average recognizes an ongoing trend through leveling out volatility and market noise. A 50-period moving average is plotted yellow on the chart.
- Moving average identifies an ongoing trend through leveling out volatility and market noise. A 30-period moving average is displayed as the green line.
- MACD indicator represents a relationship between two moving averages that is a ratio of Moving Average Convergence/Divergence. The MACD is calculated by subtracting the 26-period Exponential Moving Average (EMA) from the 12-period EMA. A 9-day EMA of the MACD called the "signal line".
- Bollinger Bands is a momentum indicator. The upper and lower bands are typically 2 standard deviations +/- from a 20-day simple moving average.
- Non-commercial traders - speculators such as retail traders, hedge funds and large institutions who use the futures market for speculative purposes and meet certain requirements.
- Non-commercial long positions represent the total long open position of non-commercial traders.
- Non-commercial short positions represent the total short open position of non-commercial traders.
- The overall non-commercial net position balance is the difference between short and long positions of non-commercial traders.