To open long positions on EUR/USD, you need:
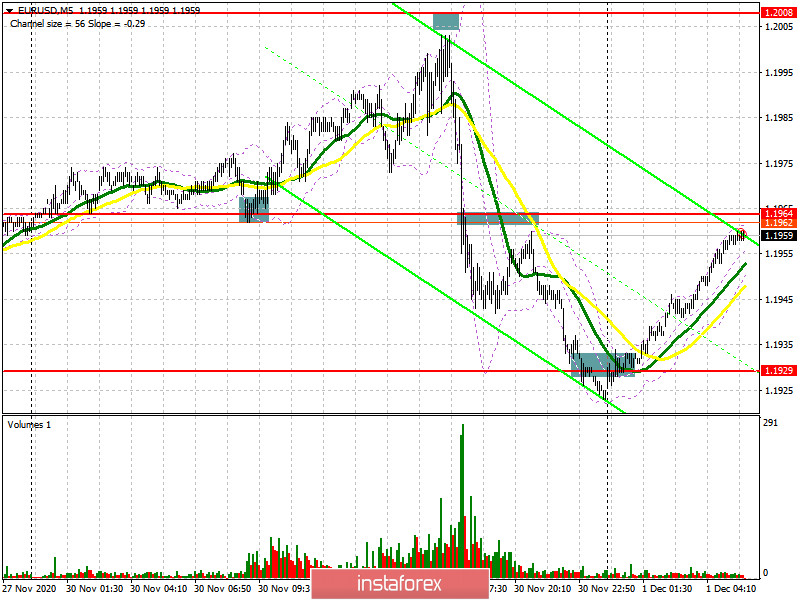
Quite a lot of profitable signals to enter the market yesterday. Let's take a look at the 5-minute chart and try to discuss them in detail. In yesterday's forecast, I paid attention to the 1.1964 level and advised you to buy the euro from it to sustain the upward trend. You can clearly see how the bulls form a false breakout (I marked this area on the chart), afterwards returning to the 1.1964 level leads to bringing back the bull market. Against this background, the bulls are practically trying to update the psychological mark of 1.2003, stopping at five points from my level of 1.2008. The upward movement was around 35 points. After weak inflation data was released, the euro sharply fell from 1.2003, which resulted in returning to the area below the 1.1964 level. Testing it from the bottom up in the afternoon provides a new sell signal for EUR/USD, bringing the pair to the 1.1929 area, which is another additional 30 points. I advised you to open long positions immediately on a rebound from the 1.1929 level, which made it possible to take another 20 points from the market. I marked all entry areas on the chart.
But before talking about the prospects for the pair's movement, let's see what happened in the futures market and how the Commitment of Traders (COT) positions changed. Buyers started to build up long positions after receiving good news about the vaccine. The complete disregard for the risks associated with the expansion of the asset repurchase program and the introduction of negative interest rates by the European Central Bank tells us that traders still believe that the eurozone economy will strongly recover early next year, while the United States will continue to "pump" money, which will affect the positions of the US dollar and weaken it. The likelihood of a later introduction of quarantine measures in America also forces traders to bypass the US dollar.
The COT report for November 24 showed an increase in long positions and a decrease in short positions. Buyers of risky assets believe that the bull market will continue and also see a breakout of the psychological mark in the area of the 20th figure, which was tested already on November 30. Long non-commercial positions increased from 203,551 to 206,354, while short non-commercial positions decreased from 69,591 to 68,104. The total non-commercial net position rose to 138,250, against 133,960 a week earlier. Take note of the delta's growth after its 8-week decline, which indicates a clear advantage of buyers and a possible resumption of the medium-term upward trend for the euro. We can only talk about an even bigger recovery when European leaders have negotiated a new trade deal with Britain. Otherwise, you will have to wait until restrictive measures that were introduced due to the second wave of coronavirus in many EU countries have finally been lifted and count on the fact that the ECB will not introduce negative interest rates already at the December meeting.

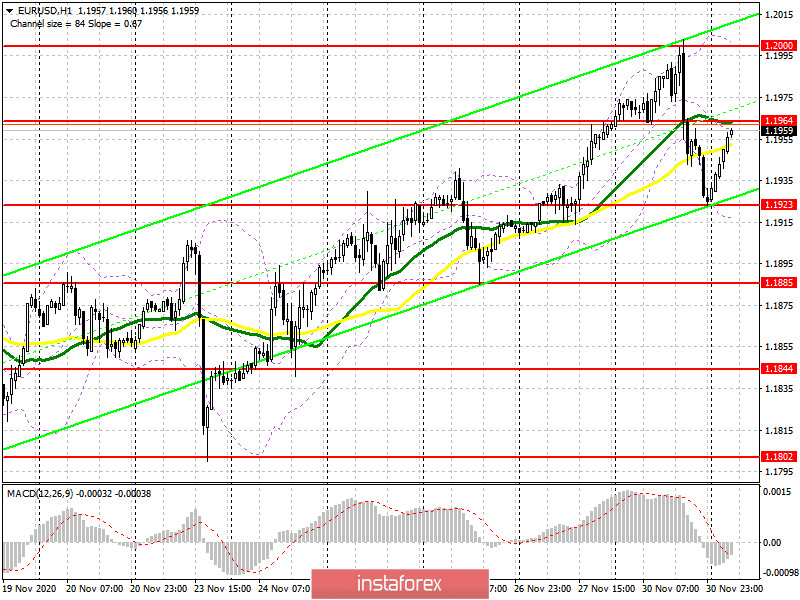
Now for the technical picture of the pair. Buyers of the euro need to regain control over resistance at 1.1964, as only this will lead to another attempt to restore the pair. A breakout and being able to settle above 1.1964 and testing it from top to bottom produces a good signal to buy the euro in hopes to return to the resistance of 1.2000, where I recommend taking profits. Only a breakthrough of this range amid good data on the manufacturing sector of the eurozone countries and inflation will open a direct path for bulls to the highs of 1.2029 and 1.2957. In case the euro falls in the first half of the day and buyers are unable to go above 1.1964, it is best not to rush with long positions, but to wait for a false breakout in the support area of 1.1923. I recommend buying EUR/USD immediately on a rebound but only from a low of 1.1885, counting on a correction of 15-20 points within the day.
To open short positions on EUR/USD, you need:
The sellers will actively defend resistance at 1.1964, where the moving averages pass, which play on their side. A false breakout there, along with weak eurozone inflation data will certainly lead to a new downward wave, in hopes to break through the low of 1.1923. Getting the pair to settle below this range will certainly open a direct road to the 1.1885 area, where I recommend taking profits. The next target will be the 1.1844 level. If bulls find the strength, and the report on production activity happens to show improvement, which is unlikely, I recommend not rushing into opening short deals. The optimal scenario would be to test yesterday's high of 1.2000, which will cause the pair to fall 15-20 points. Larger sellers will be located in the resistance area of 1.2029, and slightly higher at the high of 1.2057, from where you can also sell the euro immediately on a rebound, counting on a correction of 15-20 points within the day.
Indicator signals:
Moving averages
Trading is carried out below 30 and 50 moving averages, which indicates the bears' attempt to take control of the market.
Note: The period and prices of moving averages are considered by the author on the H1 hourly chart and differs from the general definition of the classic daily moving averages on the daily D1 chart.
Bollinger Bands
If the euro grows in the first half of the day, the upper border of the indicator around 1.1200 will act as resistance. In case the euro falls, the lower border of the indicator at 1.1923 will act as a support.
Description of indicators
- Moving average (moving average, determines the current trend by smoothing out volatility and noise). Period 50. It is marked in yellow on the chart.
- Moving average (moving average, determines the current trend by smoothing out volatility and noise). Period 30. It is marked in green on the chart.
- MACD indicator (Moving Average Convergence/Divergence — convergence/divergence of moving averages) Quick EMA period 12. Slow EMA period to 26. SMA period 9
- Bollinger Bands (Bollinger Bands). Period 20
- Non-commercial speculative traders, such as individual traders, hedge funds, and large institutions that use the futures market for speculative purposes and meet certain requirements.
- Long non-commercial positions represent the total long open position of non-commercial traders.
- Short non-commercial positions represent the total short open position of non-commercial traders.
- Total non-commercial net position is the difference between short and long positions of non-commercial traders.