What is needed to open long positions on GBP/USD
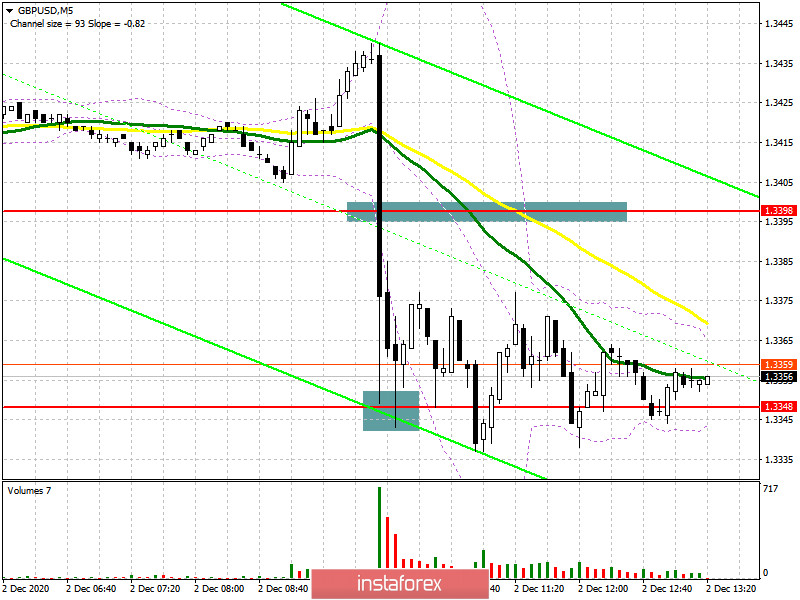
In the morning market review, I recommended opening short positions after the price had broken downwards and fixed below support of 1.3398. Let's look into a 5-minute chart. It clearly reveals that the bears were forceful to ensure a breakout. At the same time, the bears failed to form a nice signal for the market entry. I had expected to see a test of 1.3398 downwards after the breakout. So, I missed a sell deal, but opened a long deal during a bounce from support of 1.3348. I also predicted this scenario in the morning review. The first test of 1.3348 triggered a rapid 30-pips bounce.
At the moment, the technical picture is a bit different. The prior aim of the bulls is to maintain control over 1.3339 which is a crucial level to determine a further development. The attempt to break the triangle pattern failed that is clearly seen on a 5-minute chart. Only a fake breakout will enable a formation of the buy signal for GBP/USD. In this case, we can assume that the price will try to rebound to the resistance area of 1.3386 that was missed by the buyers today. A fixation above 1.3386 will open the door to a one-month high of 1.3436 where I recommend profit taking. Good news on the Brexit front will be the only catalyst for higher highs at near 1.3509 and 1.3563. Otherwise, if the sterling remains under selling pressure in the second half of the trading day and the bears wreck 1.3339, I recommend cancelling long positions until a new low of 1.3294 is tested. This low was important support last week. It is possible to open long positions from there bearing in mind a 25-30 pips intraday correction. A deeper low is seen at about 1.3251 where I assume a good bounce during the first test.
What is needed to open short positions on GBP/USD
The sellers deserved a thumps-up in the morning. However, the chart did not provide a nice sell signal. Perhaps, we will recognize a sell signal at 1.3339. The next bears' aim is a breakout and fixation below 1.3339. When tested upwards, this will form a good sell signal for GBP/USD with the targets at 1.3294 and 1.3251 where I recommend profit taking. On the contrary, bad news on the trade deal will escalate a slump of GBP/USD towards lows at 1.3192 and 1.3114. If the bulls manage to defend 1.3330 and make a fake breakout there, it would be better to delay short positions. The sensible strategy will be selling GBP if the pair fails to fix above 1.3386. I would recommend opening short deals immediately during a bounce from a one-month low of 1.3436.
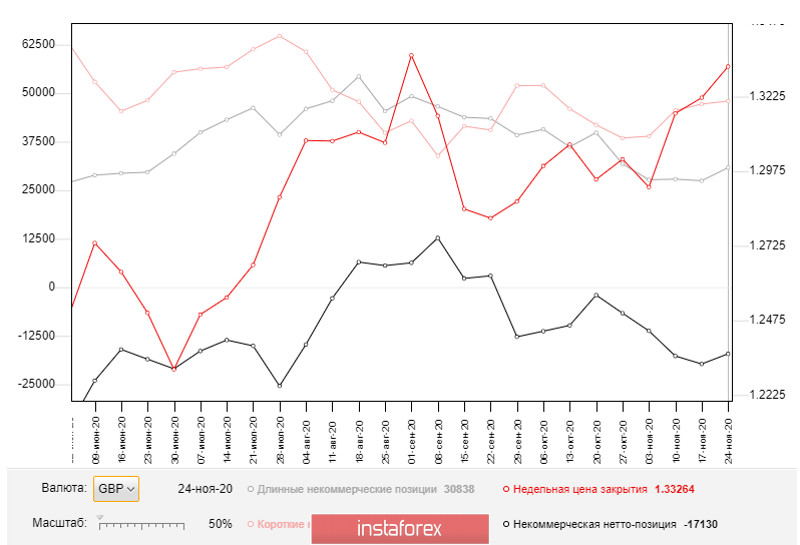
Let me remind you that the Commitment of Traders Report from November 24 logged an increase in long positions and a minor rise in short deals. Long non-commercial positions surged from 27,454 to 30,838. On the other hand, short non-commercial positions grew a bit to 47,968 from 47,200. As a result, negative non-commercial net positions came in at -17,130 against -19,746 on a week earlier. This data proves that the sterling sellers are still setting the tone in the market. Nevertheless, market participants are regaining risk appetite. The trade deal between London and Brussels is sure to boost the risk-on mood.
Signals of technical indicators
Moving averages
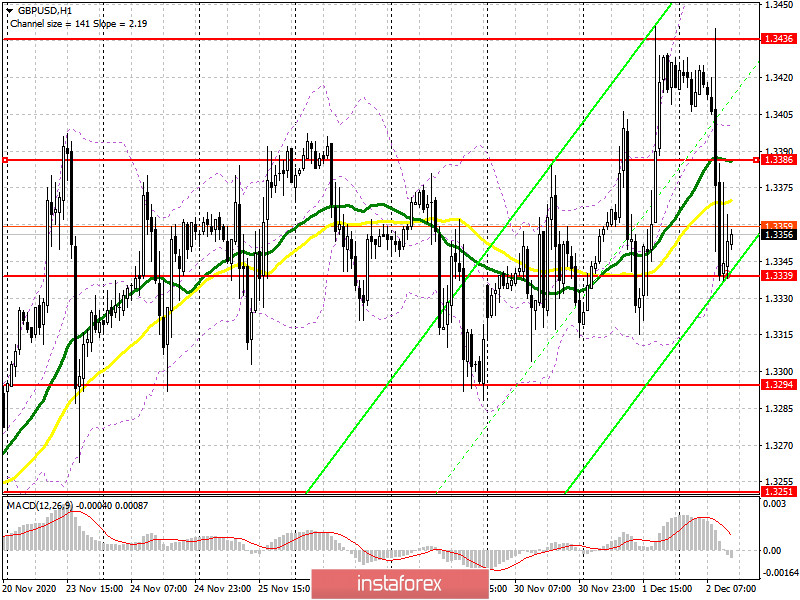
The pair is trading at about 30- and 50-period moving averages. It indicates a range-bound manner of trading.
Remark. The author is analyzing a period and prices of moving averages on the 1-hour chart. So, it differs from the common definition of classic daily moving averages on the daily chart.
Bollinger Bands
A breakout of the indicator's lower border to near 1.3339 will trigger a new bearish wave for GBP. In case the currency pair rises, the indicator's upper border of about 1.3465 will serve as resistance.
EUR growth will be capped by the upper level of the indicator at near 1.1835. In case EUR declines, the lower border of the indicator at near 1.1755 will act as support.
Definitions of technical indicators
- Moving average recognizes an ongoing trend through leveling out volatility and market noise. A 50-period moving average is plotted yellow on the chart.
- Moving average identifies an ongoing trend through leveling out volatility and market noise. A 30-period moving average is displayed as the green line.
- MACD indicator represents a relationship between two moving averages that is a ratio of Moving Average Convergence/Divergence. The MACD is calculated by subtracting the 26-period Exponential Moving Average (EMA) from the 12-period EMA. A 9-day EMA of the MACD called the "signal line".
- Bollinger Bands is a momentum indicator. The upper and lower bands are typically 2 standard deviations +/- from a 20-day simple moving average.
- Non-commercial traders - speculators such as retail traders, hedge funds and large institutions who use the futures market for speculative purposes and meet certain requirements.
- Non-commercial long positions represent the total long open position of non-commercial traders.
- Non-commercial short positions represent the total short open position of non-commercial traders.
- The overall non-commercial net position balance is the difference between short and long positions of non-commercial traders.