What is needed to open long positions on EUR/USD:
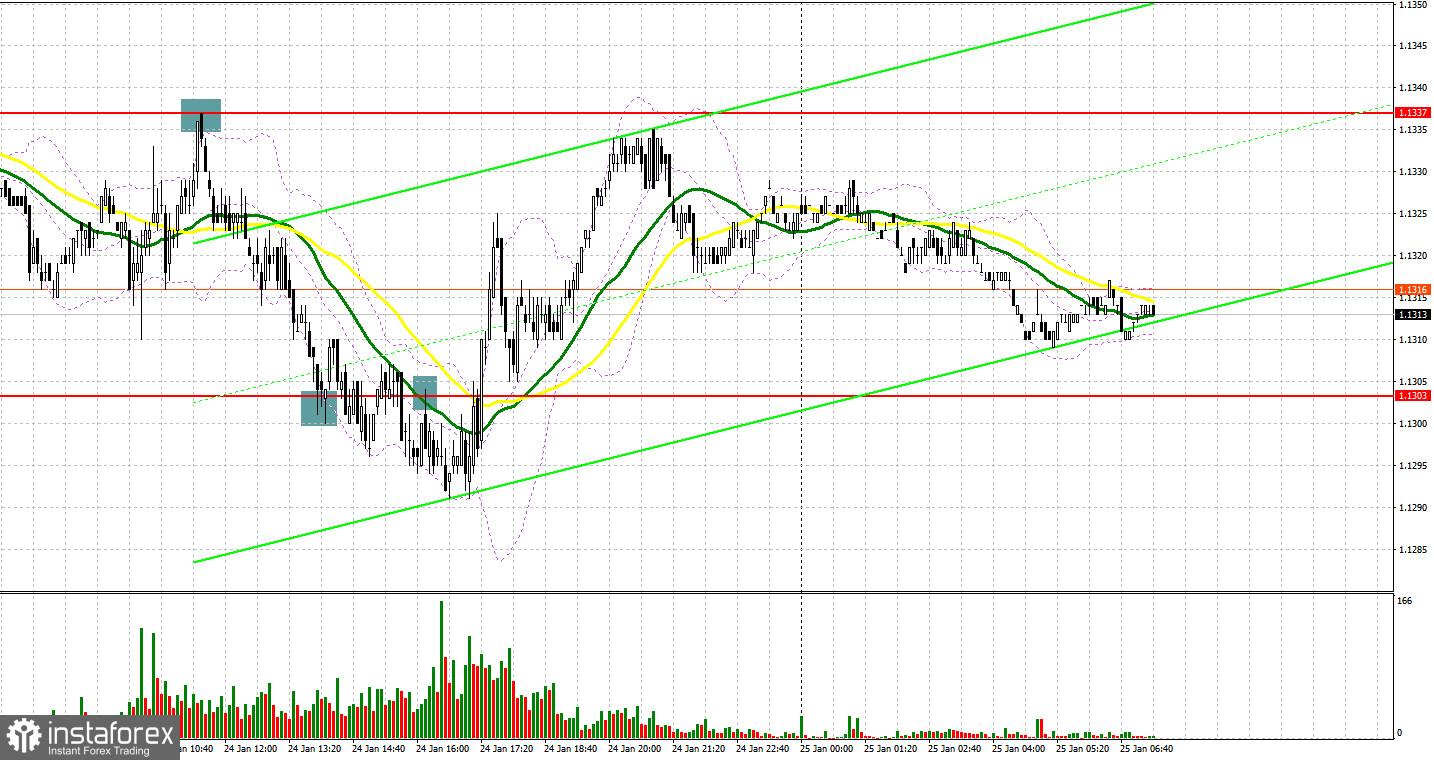
Yesterday, there were several signals to enter the market. Let's look at the 5M chart and figure out what actually happened. In the morning article, I highlighted the 1.1337 level and recommended making decisions with this level in focus. Today, traders are digesting the results of the EU PMI Services and Manufacturing Indexes. They turned out to be rather mixed. However, the Composite Index for the eurozone declined in January this year. For this reason, bulls were unable to push the euro/dollar pair above the resistance level of 1.1337 even despite Germany's strong PMI indexes data. A signal to sell the euro appeared after a false breakout of 1.1337. As a result, the euro fell by 35 pips. In the afternoon, bulls tried to defend the level of 1.1303. There was even an entry point into long positions. However, it did not facilitate the growth of the pair. A sell signal was formed after a breakout and an upward test of 1.1303 in the middle of the US session. The euro decreased by about 10 pips. Shortly after, the bulls managed to push the pair back to 1.1303.
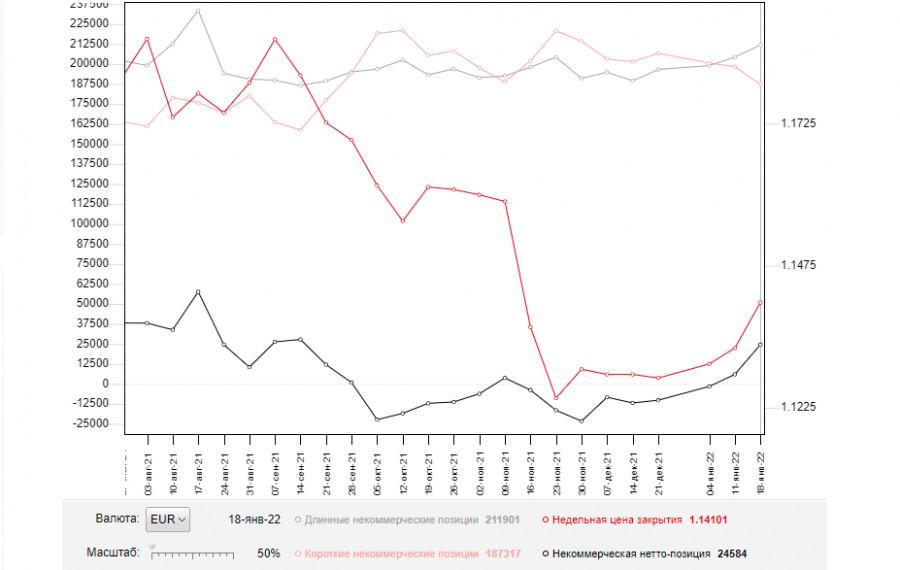
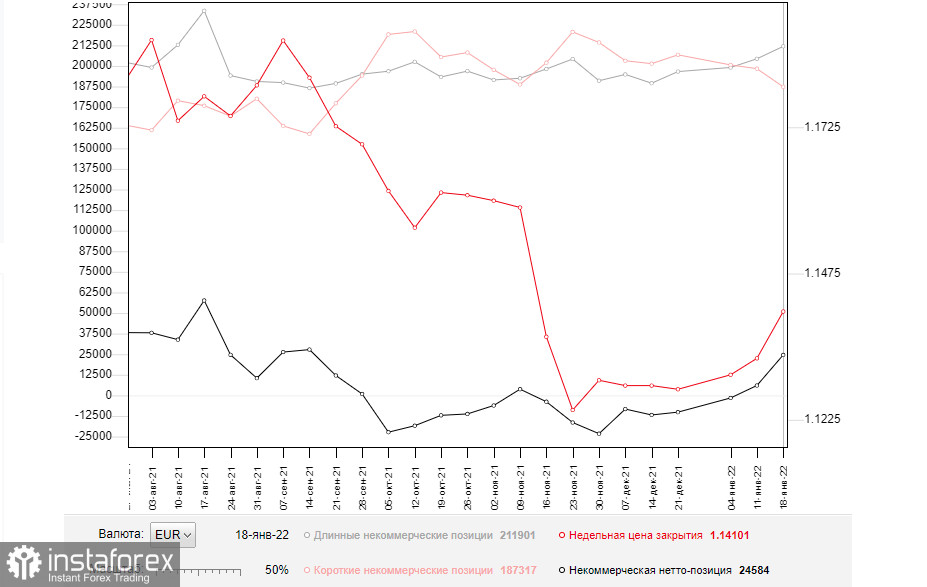
Before we continue to analyze further prospects of the euro/dollar pair, let's see what happened in the futures market and how positions in the Commitment of Traders have changed. The COT report (Commitment of Traders) for January 18 showed an increase in long positions and a drop in short ones, triggering a further increase in the positive delta. It implies that demand for the euro remains buoyant despite high expectations of monetary policy tightening by the Fed. Notably, demand for the single currency will only rise amid new corrections. This week, traders are waiting for the results of the FOMC meeting, namely the monetary policy decision. Some traders expect the central bank to raise the interest rate already during the January meeting. The Fed will also announce a shrink in the balance sheet. The trajectory of the pair also depends on the rhetoric of Fed Chairman Jerome Powell. If he expresses concerns about surging inflation, demand for the US dollar will only grow. Currently, analysts predict four interest rate hikes this year, while some economists believe that there will be a five key rate hike. Meanwhile, the European Central Bank plans to fully complete its emergency purchase program in March this year. However, it is not going to take any other measures to tighten its monetary policy. It may limit the upward movement of risky assets. The COT report indicates that the number of long non-profit positions rose to 211,901 from 204,361, while the number of short non-profit positions fell to 187,317 from 198,356. It means that traders continue to open long positions on the euro amid the expectation of an uptrend. At the end of the week, the total number of non-commercial net positions remained positive and amounted to 24,584 against 6,005. The weekly closing price climbed to 1.1410 against 1.1330 a week earlier.
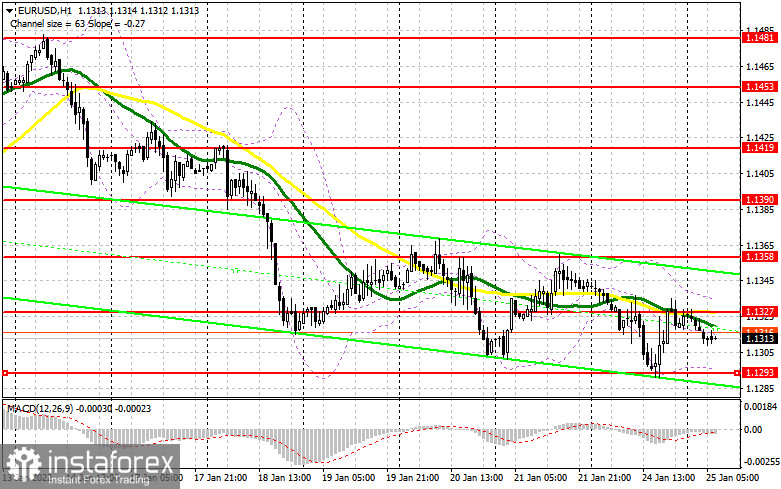
As for technical indicators, they have little changed since yesterday. The pair remains in the sideways channel ahead of crucial macroeconomic statistics which is due on Wednesday. A butch of important reports for Germany is on tap today in the morning. The euro may regain ground provided that the report turns out to be better than economists' forecasts. If the euro declines in the morning, bulls will try to push the pair to around the 13th pattern. Only the formation of a false breakout at 1.1293 may offer a good entry point into long positions amid expectations of completing a downward correction. However, the pair should hold a strong upward movement. If at the time of the test of 1.1293, bulls will not be able to push the pair higher, it is better to postpone long positions. A break of the lower boundary of the sideways channel may lead to a big sell-off. In this case, I advise buying the pair only after it approaches the next support level of 1.1265. However, it is recommended to enter the market only if a false breakout took place. It would be appropriate to open long positions taking into account a rebound from the low of 1.1248 or even a lower low around 1.1224. Don't forget to allow for a 15-20 pip intraday correction.
Bulls also need to regain control over the 1.1327 level where the moving averages are located in the negative zone. A breakout and consolidation above this level, as well as the positive Ifo Business Climate Index, will certainly boost risk appetite. It may give an excellent entry point for buying EUR/USD. It could help the pair approach the next resistance level of 1.1358. If the price break above this level, it will resume the upward movement. So, it may well rise to the highs of 1.1390 and 1.1419 where I recommend profit taking.
What is needed to open short positions on EUR/USD:
Bears are now not trying to take control. However, they have more chances to cement the bearish market. It is recommended to sell the euro in the first half of the day if there is a formation of a false breakout at the level of 1.1327 The moving averages are located in the negative zone near that level. It is an excellent entry point into short positions with the prospect of a further decline to the lower boundary of the sideways channel at 1.1293. Yesterday bears failed to push the pair below this level. In case of weak data on the IFO index, a breakout, and an upward test of this range, there could be an additional signal to enter the market. The pair is likely to decline to a low of 1.1265. It will open the way to 1.1248. A more distant target level will be 1.1224 where I recommend closing positions. If the pair recovers during the European session and bears are unable to defend the level of 1.1327, it is better to open short positions after a false breakdown at 1.1358. I do not advise opening short positions above the upper boundary of the sideways channel as it may lead to a downward reversal. It is recommended to open short positions on EUR/USD after a rebound from the highs of 1.1390 and 1.1419, bearing in mind an intraday downward correction of 15-20 pips.
Signals of technical indicators
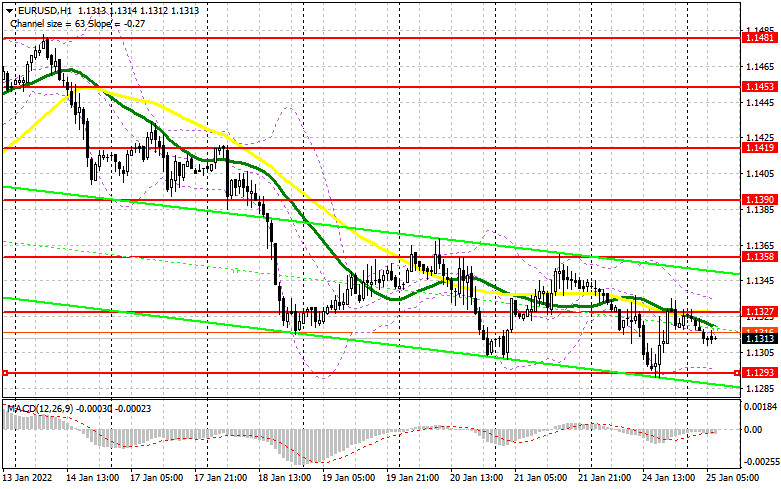
Moving averages
EUR/USD is trading slightly below 30- and 50-period moving averages. It means that bears are exerting pressure on the pair.
Remark. The author is analyzing the period and prices of moving averages on the 1-hour chart. So, it differs from the common definition of classic daily moving averages on the daily chart.
Bollinger Bands
A breakout of the upper border at about 1.1330 will trigger a new bullish wave of EUR. Alternatively, a breakout of the lower border at about 1.1293 will escalate pressure on EUR/USD.
Definitions of technical indicators
- Moving average recognizes an ongoing trend through leveling out volatility and market noise. A 50-period moving average is plotted yellow on the chart.
- Moving average identifies an ongoing trend through leveling out volatility and market noise. A 30-period moving average is displayed as the green line.
- MACD indicator represents a relationship between two moving averages that is a ratio of Moving Average Convergence/Divergence. The MACD is calculated by subtracting the 26-period Exponential Moving Average (EMA) from the 12-period EMA. A 9-day EMA of the MACD called the "signal line".
- Bollinger Bands is a momentum indicator. The upper and lower bands are typically 2 standard deviations +/- from a 20-day simple moving average.
- Non-commercial traders - speculators such as retail traders, hedge funds, and large institutions who use the futures market for speculative purposes and meet certain requirements.
- Non-commercial long positions represent the total long open position of non-commercial traders.
- Non-commercial short positions represent the total short open position of non-commercial traders.
- The overall non-commercial net position balance is the difference between short and long positions of non-commercial traders.