empty
 
 
15.08.2022 08:37 AM
Breaking forecast for GBP/USD on August 15, 2022

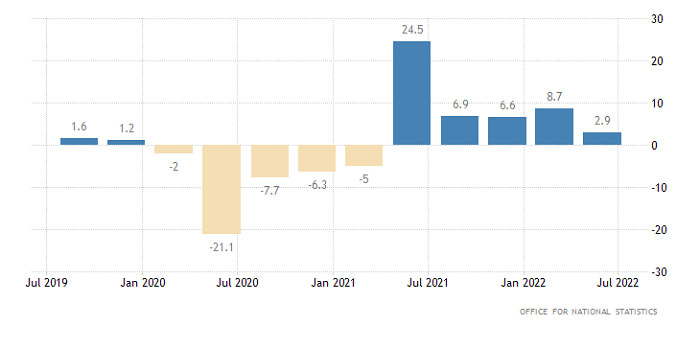
On Friday, the UK statistical data surprised traders. In the second quarter, the GDP growth rate declined to 2.9% from 8.7%, whereas economists had expected a slowdown to 2.8%. Although the growth pace is slackening, it is doing this slower than anticipated. In addition, the UK industrial production increased by 2.4% compared to a rise of 1.8% in the previous period. Analysts had predicted a smaller increase of just 1.7%. Notably, the previous figures were downwardly revised to 1.4%.

UK GDP Growth Rate

This image is no longer relevant

Nevertheless, the pound sterling continues losing value. The fact is that the recent rise in the British pound was caused by the US inflation figures and hopes that the Fed would take a less aggressive approach to the key interest rate hike. However, some comments provided by the regulator's representatives made it clear that such conclusions were premature. As a result, the market returned to the levels recorded before the publication of the US inflation figures. The price is likely to settle near the current levels in an anticipation of news or fresh data that may clarify what actions the Fed may take in the near future.

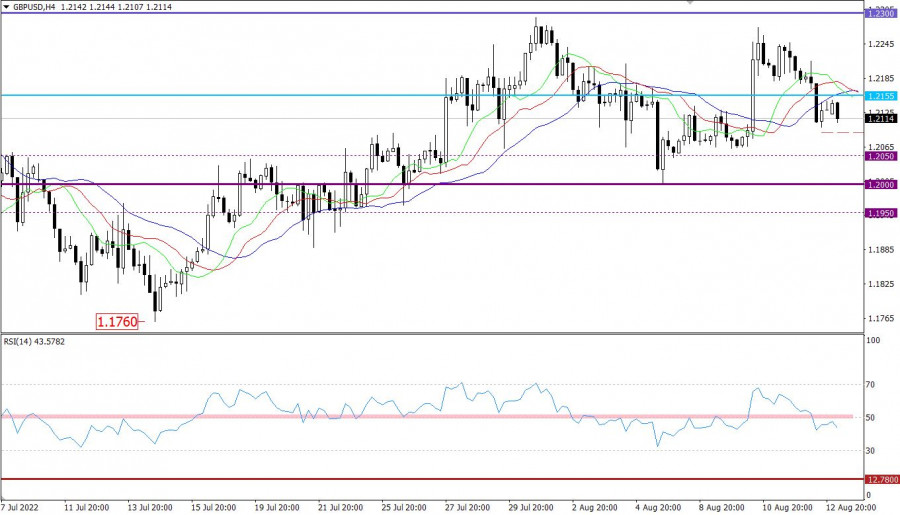
Against the backdrop, the pound/dollar pair downwardly broke the level of 1.2155. This allowed the US dollar to recover after the recent decline recorded in the middle of the previous week.

On the four-hour chart, the RSI technical indicator downwardly crossed the 50-day moving average, signaling a rise in the volume of short positions. On the daily chart, the indicator is slightly above line 50, which points to the ongoing correctional movement.

On the four-hour chart, the Alligator's moving averages are intersecting each other, thus reflecting a slowdown in the correctional movement. On the daily chart, the indicator is ignoring local price changes on the intraday periods. Moving averages are headed upward.

On the daily chart, we see a correctional movement from 1.1760. There is no signal about a change in the mid-term trend.

This image is no longer relevant

Outlook

Under the current conditions, traders remain interested in the US dollar. That is why the pair's settlement below 1.2090 may cause even a deeper decline to the psychological level of 1.2000 (1.2050).

The alternative scenario will become possible if the price returns to 1.2160 on the four-hour chart. In this case, the downward trend may stop.

In terms of the complex indicator analysis, we see that on the short-term and intraday periods, there is a sell signal caused by the recovery of the greenback. On the mid-term trend, the indicator is signaling mixed opportunities due to the slowdown in the downtrend.

Dean Leo,
Chuyên gia phân tích của InstaForex
© 2007-2024
Kiếm lợi nhuận từ những biến đổi giá của tiền điện tử với InstaForex.
Tải MetaTrader 4 và mở giao dịch đầu tiên của bạn.
  • Grand Choice
    Contest by
    InstaForex
    InstaForex always strives to help you
    fulfill your biggest dreams.
    THAM GIA CUỘC THI
  • Tiền gửi lần truy cập
    Ký quỹ tài khoản của bạn với $3000 và nhận được $1000 nhiều hơn!
    Trong Tháng 4 chúng tôi xổ $1000 trong chiến dịch Chancy Deposit!
    Có được một cơ hội giành chiến thắng bằng việc ký quỹ $3000 vào một tài khoản giao dịch. Đáp ứng được điều kiện này, bạn trở thành một người tham gia chiến dịch.
    THAM GIA CUỘC THI
  • Giao dịch khôn ngoan, thành công
    Nạp tiền vào tài khoản của bạn với ít nhất $ 500, đăng ký cuộc thi và có cơ hội giành được các thiết bị di động.
    THAM GIA CUỘC THI
  • 100% tiền thưởng
    Cơ hội duy nhất của bạn để nhận 100% tiền thưởng khi gửi tiền
    NHẬN THƯỞNG
  • 55% Tiền thưởng
    Đăng ký tiền thưởng 55% cho mỗi lần gửi tiền của bạn
    NHẬN THƯỞNG
  • 30% tiền thưởng
    Nhận 30% tiền thưởng mỗi khi bạn nạp tiền vào tài khoản của mình
    NHẬN THƯỞNG

Các bài báo được đề xuất

Không thể nói chuyện ngay bây giờ?
Đặt câu hỏi của bạn trong phần trò chuyện.
Widget callback