For the first time since the beginning of March, the pound/dollar currency pair turned out to be above the level of 1.2850, and somewhere behind, the range level of 1.2770 disappeared, followed by the lows. Is it really the end of a downward development or we are dealing with something else? These questions overcome every second trader. This is not so simple, if we analyze the US dollar as a separate unit, it will be seen that it is under pressure from speculators throughout the currency market,, that is, the dollar fell under the sale. I deeply doubt whether this factor will be able to change the trend, since the sell-off of the US dollar is a local phenomenon, and the pressure on the UK economy, in particular, the pound sterling is a long-term factor in the market. That is, sooner or later, speculators will get enough of cheap dollars and an understanding will come that the rate of the pound sterling is unjustifiably overvalued, and then they will remember about Brexit, which is stalling in place, about the consequences of the coronavirus crisis, and indeed about the outflow of investments. And what do we get in the end? That's right, a downward price movement.
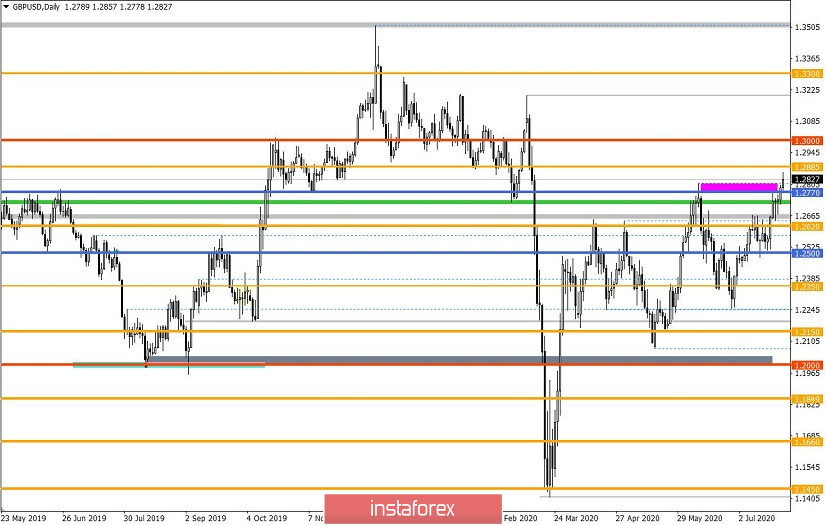
Analyzing the current situation with the quotes, I recall one theory about which we wrote back in early June. It was about changing market ranges 1.2150 // 1.2350 // 1.2620 ---> 1.2770 // 1.3000 // 1.3300, which would lead to stabilization of the emotional mood of the market. This step has come, it will be clear only if the psychological level of 1.3000 is overcome, before it the chance of a return below 1.2770 is still high.
Analyzing the trading chart by the minute, we can see that the breakdown of the level of 1.2770 which occurred during the beginning of the American session on July 24, but the inertial movement from the breakout occurred already during the Asian session on July 27, which indicates the prevailing speculative background at low trading volumes. The weakening of the US dollar took place throughout the currency market.
In terms of volatility, one cannot say that there is an ultra-high dynamic, the daily indicator keeps the level below 100 points, but in this case, this is enough to form speculative jumps in short-term periods.
Looking at the trading chart in general terms (daily period), it can be seen that the above theory of price transition to a new range reflects the levels of concentration of trading forces in October-December 2018, January-May 2019 and January 2020.
The news background on Friday included data on retail sales in Britain for June, where they recorded an increase of 13.9%, an annualized slowdown of -1.6% against -12.9%. The recovery was due to the lifting of quarantine measures. After that, preliminary data on the business activity index came out, where the manufacturing sector recorded an increase from 50.1 to 53.6, and an increase from 48.3 to 55.1 in the service sector. The composite index also became better than the forecast of 47.7 -> 57.1.
The market literally ignored the package of statistics on Britain, the pound moved into strengthening closer to the American session.
In the second half of the day, similar data on the PMI index came out, but this time for the United States, where the index growth was recorded, but the forecasts did not coincide. The manufacturing sector reflected growth from 49.8 to 51.3 (forecast 51.5), the service sector grew from 47.9 to 49.6 (forecast 51.0).
The market's reaction was not bright to the statistical data, as if the quote was under the influence of a kind of inertia in terms of the weakening of the US dollar.
In terms of the information background, we have trade negotiations between Brussels and London, where the next round ended in vain. More and more, dignitaries comment that there will be no deal, and the negotiators Michel Barnier and David Frost have squandered all their optimism.
In turn, the German government is calling on London to show greater realism in its trade and security negotiations. According to the official representative of Germany, the EU is ready to move the negotiations quickly, provided the British side will meet halfway.
Let me remind you that the stumbling block for the agreement remains access to European fishing fleets to British waters and agreements to ensure that neither side will undermine the price due to lower regulatory standards or unfair subsidies to the industry.
Today, in terms of the economic calendar, we have data on durable goods orders in the United States that could grow by 5%. If the forecasts are confirmed, the dollar will probably go into a strengthening stage.
Further development
Analyzing the current trading chart, we can see a slight pull back towards the level of 1.2800, but given the scale of the overbought pound sterling, this is a minor change. Now, everything rests on the fact of the sale of the US dollar and how long will there be enough speculators to weaken it. The change in market ranges will be taken into consideration, but, as I wrote earlier, the quote must first consolidate above the psychological level of 1.3000. Until the price consolidates above 1.3000, work will be done based on the situation, or rather from the fixation points 1.2800 and 1.2860, working on local speculations.
It can be assumed that a breakdown of one of the coordinates 1.2800 or 1.2860 can lead to a surge in activity, which will lead to an inertial move towards the breakdown.
Based on the above information, we will display trading recommendations:
- Consider sell deals below 1.2795, towards 1.2770
- Consider buy deals above 1.2865, towards 1.2900-1.2920.
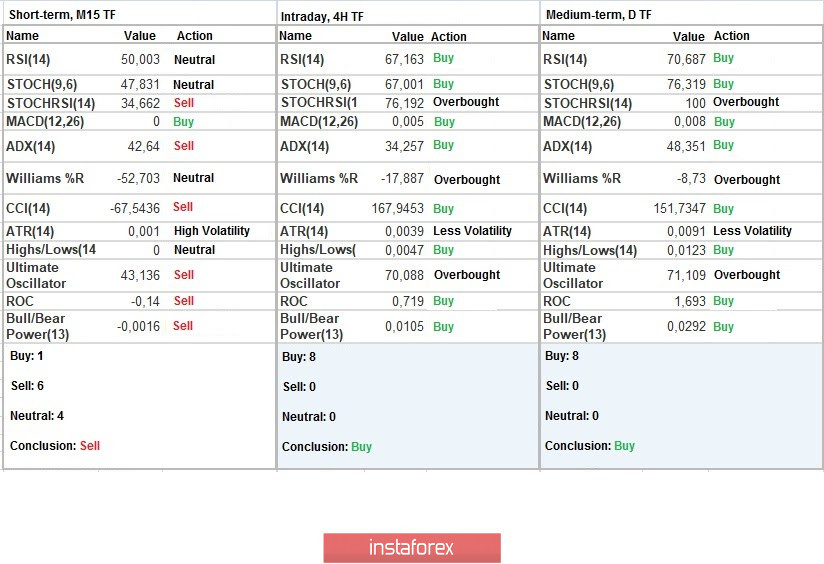
Indicator analysis
Analyzing different sectors of time frames (TF), we see that the indicators of technical instruments on minute intervals signal a sell due to a small pullback. Meanwhile, hourly and daily periods maintain a buy signal due to price concentration above 1.2770.
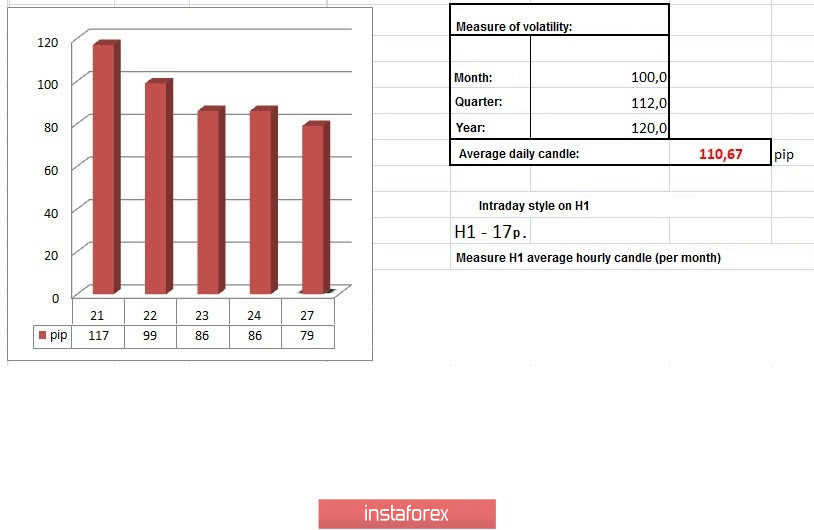
Weekly volatility / Volatility measurement: Month; Quarter; Year
Measurement of volatility reflects the average daily fluctuation, calculated per Month / Quarter / Year.
(July 27 was built taking into account the time of publication of the article)
The volatility of the current time is 579 points, which is 28% below the daily average. It can be assumed that the given speculative mood will still remain in the market, which will give an opportunity for further acceleration of volatility.
Key levels
Resistance zones: 1.2885 *; 1.3000; 1.3170 **; 1.3300 **; 1.3600; 1.3850; 1.4000 ***; 1.4350 **.
Support zones: 1.2770 **; 1.2620; 1.2500; 1.2350 **; 1.2250; 1.2150 **; 1.2000 *** (1.1957); 1.1850; 1.1660; 1.1450 (1.1411); 1.1300; 1.1000; 1.0800; 1.0500; 1.0000.
* Periodic level
** Range level
*** Psychological level