EUR/USD 1H
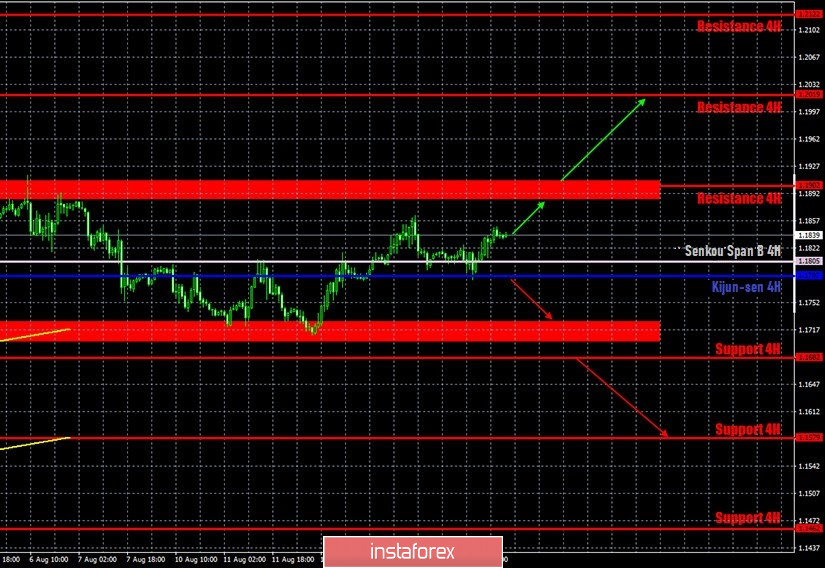
The euro/dollar pair reached the Kijun-sen and Senkou Span B lines on the hourly timeframe on August 14, which are currently placed exactly in the middle of the 1.17-1.19 side channel. We have clear lower and upper borders of this channel on the current timeframe, expressed in the areas of 1.1703-1.1727 and 1.1886-1.1910. The pair's quotes have already reached both the upper and lower areas several times and have not been able to overcome them. So nothing changed on Friday. The pair still retains the chances of a new growth to the 1.1886-1.1910 area, as it failed to gain a foothold below the Kijun-sen and Senkou Span B lines. However, the flat is maintained in general, and each trader decides for himself whether he wants to trade in the flat.
EUR/USD 15M

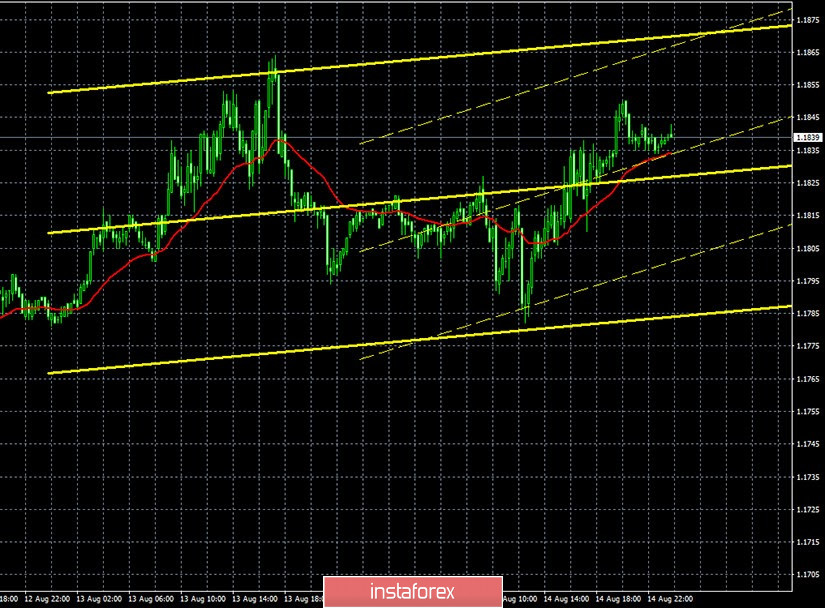
Both channels of linear regression are still directed upwards on the 15-minute timeframe, since traders' moods did not change much on Friday. A new Commitment of Traders (COT) report was also released last Friday. According to this report, non-commercial traders reopened Buy-contracts and closed Sell-contracts. Thus, the net position for the "non-commercial" category of traders, which, as we recall, is the most important and significant category of traders considered to drive the currency market, has grown again, this time by 15,000, which is a lot (5,128 Buy-contracts were opened and 9,681 Sell-contracts were closed). This leads to the conclusion that the mood of big traders has not changed at all over the past week. In principle, the same conclusion can be drawn by looking at the chart of the euro/dollar currency pair itself. The pair has been in the side channel since July 27, which is three weeks ago. Thus, we can not even say that the euro has started to fall in price, which would allow us to conclude that the mood of the major players has changed. But traders managed to adjust the pair by a high of 200 points during all this time, which is very small to be reflected in the COT report.
The fundamental background for the EUR/USD pair was very interesting and expected last Friday. The main report of the day was the EUR GDP for the second quarter. And although the forecasts and the real value of the indicator completely coincided, nevertheless, we now know exactly how much the European economy has contracted and we can compare this figure with the fall of the American one. In principle, even before the release of the report, it was clear that the US losses are much more serious. The eurozone's GDP lost just 12.1%, while the US GDP lost 33%. Thus, the American economy has suffered three times worse from the coronavirus crisis, which has not yet ended and still continues to rage in the US. For example, more than 60,000 cases of the disease were again recorded per day in America. Therefore, the American economy may also recover at a slower pace than the European one in the third and fourth quarters of 2020. A report on US retail sales was released last Friday, which turned out to be slightly worse than predicted. Therefore, market participants also had grounds for new purchases of the pair in the second half of the day.
Based on the above, we have two trading ideas for August 17:
1) Buyers continue to wait for the right moment to re-start active trading. To make new purchases of the euro, it is recommended to wait for the price to consolidate above the resistance area of 1.1886 - 1.1910. Then we will recommend buying the pair with the target at the resistance level of 1.2019. In this case, the potential Take Profit is about 80 points. Inside the sideways channel, you can also trade relative to the Kijun-sen line with the targets of the upper and lower boundaries.
2) Bears continue to experience big problems and cannot go below 1.1715. We recommend opening sales after breaking through the support area 1.1702 - 1.1727 with the first target at the level of 1.1579. Potential Take Profit in this case will be about 90 points. If the price fixes below the Kijun-sen line, you can open small shorts with the target of 1.1720.
Explanations for illustrations:
Support and Resistance Levels are the levels that serve as targets when buying or selling the pair. You can place Take Profit near these levels.
Kijun-sen and Senkou Span B lines are lines of the Ichimoku indicator transferred to the hourly timeframe from the 4-hour one.
Support and resistance areas are areas from which the price has repeatedly rebounded off.
Yellow lines are trend lines, trend channels and any other technical patterns.