EUR/USD 1H
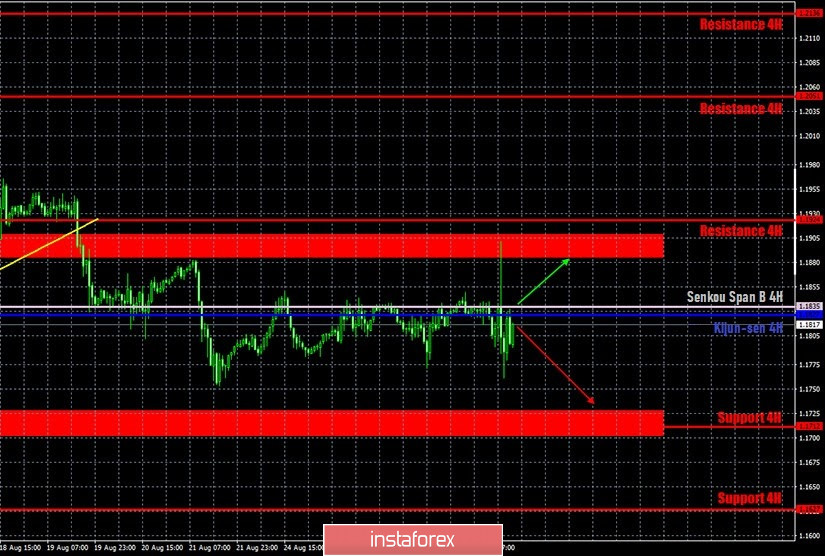
The euro/dollar pair literally surged for an hour and reached the 1.1886-1.1910 area on the hourly timeframe on August 27 and then it immediately fell by the same 110 points, returning to its original positions. Of course, such volatility and market behavior were associated with Federal Reserve Chairman Jerome Powell's speech in Jackson Hole, which had just begun by that time. However, market participants began to panic even before this event, not knowing what to expect. In general, the technical picture has not changed at all, as the pair continues to trade between the levels of $1.17 and $1.19. Or between the areas of 1.1702-1.1728 and 1.1886-1.1910, if you like. The essence remains the same - movement inside the side channel. The quotes tried to leave this channel on August 18-19, but quickly returned to it.
EUR/USD 15M

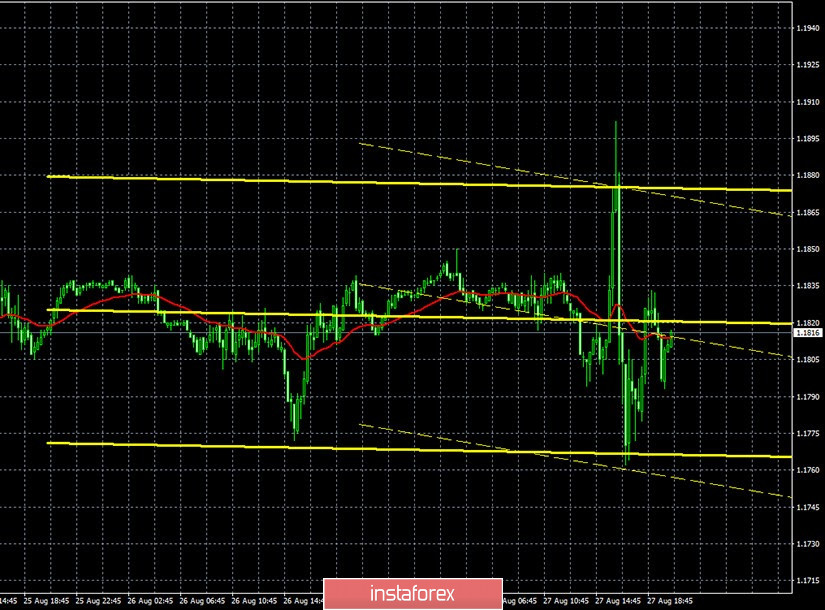
Both linear regression channels reverse every day on the 15 minute timeframe as the pair is constantly changing direction. In general, it is flat. The latest Commitments of Traders (COT) report was released last Friday. According to this report, non-commercial traders were extremely calm during the reporting week (August 12-18). During this period, the "non-commercial" category of traders, which is considered the most important, closed 4,500 Buy-contracts and 4,500 Sell-contracts. Thus, the net position for this category of professional players has not changed. Accordingly, we cannot draw a conclusion about the change in the mood of professional traders. The COT report still does not provide any grounds to assume that the upward trend has ended. Even if we take into account the fact that the pair fell by 200 points in the period from August 19 to 21, it still does not change anything. The pair has already fallen by 200 points during the current upward trend, which has been forming for more than three months. This value continues to remain small, since the pair's overall growth reached around 1200 points during this period. The pair has been in an absolutely incomprehensible movement throughout the current week, and certainly this movement cannot mean a change in the mood of large market participants. The last three trading days of this week will not be included in the new COT report, but even without them it is clear that no major changes should be expected from it.
The fundamental background for the EUR/USD pair will be extremely weak on Friday, August 28. The Jackson Hole symposium will continue, but no important speeches by the ECB or Fed representatives are planned. There is also nothing special to single out from macroeconomic data. Various secondary indicators such as the level of consumer confidence and the index of economic sentiment in the European Union will be published. Since the beginning of the pandemic, market participants around the world have constantly ignored much more significant news. Thus, the probability of working out these reports is zero. In the United States, we can expect data on personal income and spending of Americans, as well as the University of Michigan consumer confidence index. These reports are also completely secondary. Thus, we can conclude that there will be no significant reaction to macroeconomic data on Friday.
Based on the above, we have two trading ideas for August 28:
1) Bulls in general continue to wait for the right moment to resume the upward trend. Or that the bears will finally take the initiative into their own hands. The pair continues to trade slightly below the Senkou Span B line, but cannot continue to fall. Thus, in order for the upward trend to resume, the quotes must return to the area above the 1.1886-1.1910 range. In this case, we will recommend buying the euro with the target at the resistance level of 1.2051. Take Profit in this case will be up to 110 points.
2) Bears have finally seized the initiative in the market, but they do not have big dividends from this. Thus, you can sell the pair with the target of the support area of 1.1702-1.1727, if the price manages to stay below the Senkou Span B line (1.1835), but you can also see how the quotes "willingly" move down. In this case, the potential Take Profit is 70-80 points.
Explanations for illustrations:
Support and Resistance Levels are the levels that serve as targets when buying or selling the pair. You can place Take Profit near these levels.
Kijun-sen and Senkou Span B lines are lines of the Ichimoku indicator transferred to the hourly timeframe from the 4-hour one.
Support and resistance areas are areas from which the price has repeatedly rebounded off.
Yellow lines are trend lines, trend channels and any other technical patterns.