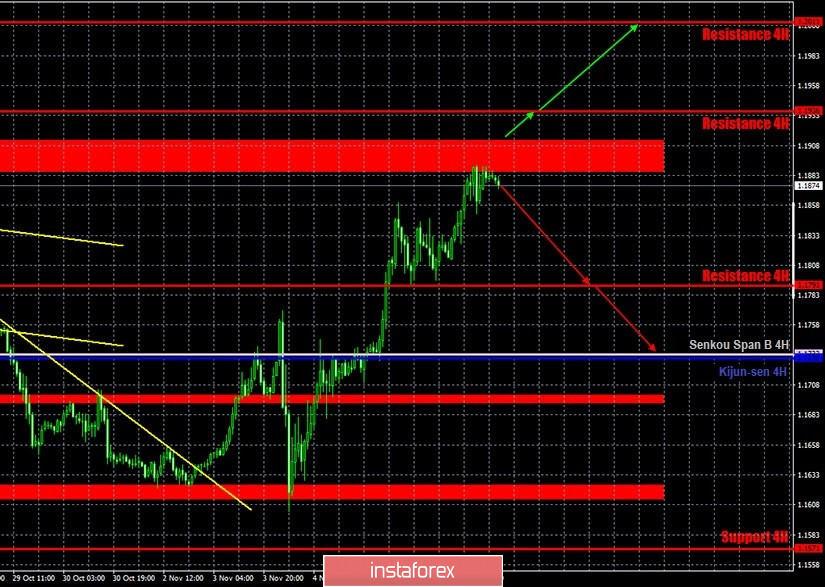
EUR/USD 1H
The EUR/USD pair continued to move up on the hourly timeframe on Friday, November 6 and reached the resistance area of 1.1886-1.1912. Buyers failed to overcome this area, so rebounding from it may trigger a downward correction. Moreover, this very correction was brewing for the entirety of the previous week, since after it fell last Wednesday night, the pair has moved up for the rest of the week. Moreover, the pair has reached the 1.1886-1.1912 area, and the upper line of the horizontal channel, in which it has been trading for most of the last three months. Therefore, we would say that now there is an extremely high probability of a rebound from this line and area and also a new round of downward movement. Otherwise, if the bulls manage to overcome this area, then the chances of a new upward trend will increase many times over.
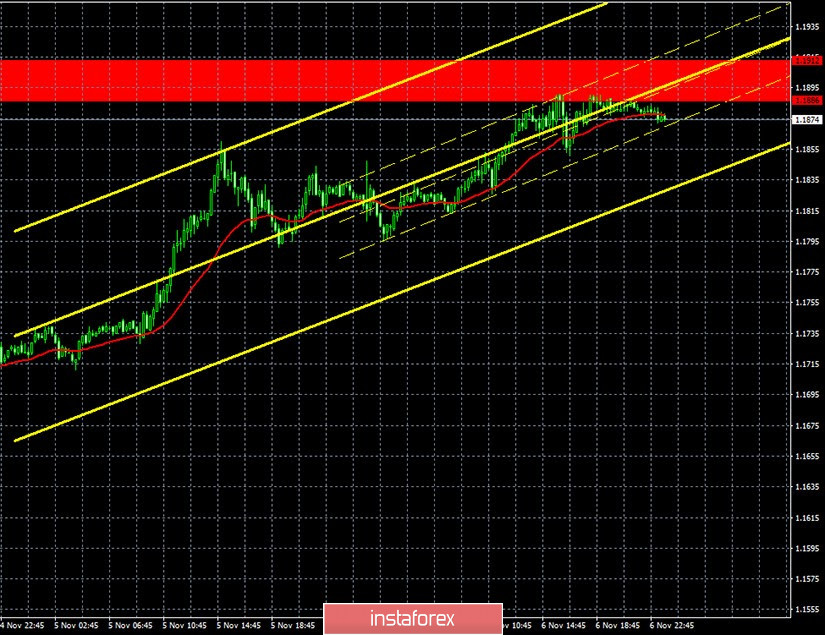
EUR/USD 15M
The linear regression channels are directed to the upside on the 15-minute timeframe, which reflects the nature of the movement on the hourly chart during the past day. However, we might see a downward reversal and quotes could fall in the near future. We clearly see the resistance area, which we mentioned above, as well as several price rebounds from it. After impulsively moving by 280 points last week, buyers did not have enough strength to overcome this area.
COT report
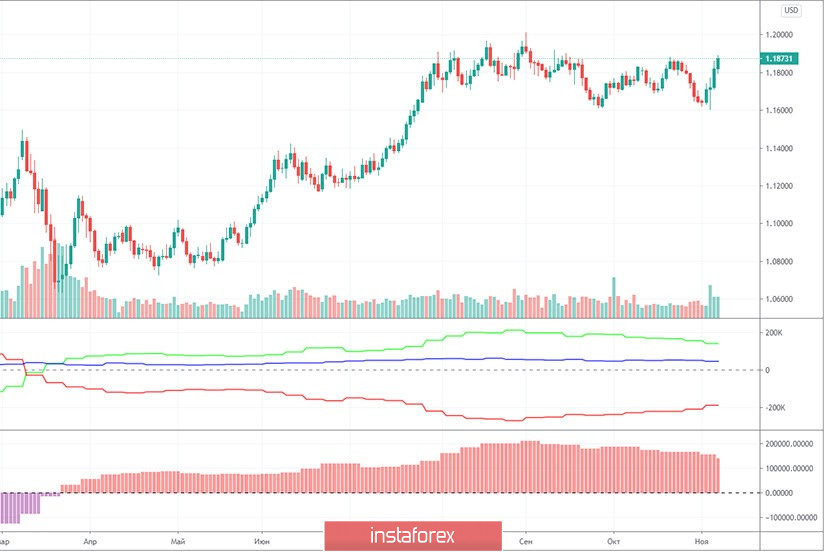
Recall that the last Commitment of Traders (COT) report showed that professional traders reduced Buy-contracts (longs) and raised the number of Sell-contracts (shorts). The net position of the Non-commercial group fell by 17,000 contracts at once. This suggests that the most important group of traders continues to reduce interest in the euro. Most of the past week (when the pair was trading higher) did not make it to the latest COT report. The traders' sentiment could have changed to a more bullish one during these four days. However, we will only find out this Friday, which is when the new COT report is released. If it does not show a strong increase in net position among non-commercial traders, then we will be even more confident that the downside movement will resume.
The US published important macroeconomic statistics last Friday. A very significant report, the NonFarm Payrolls, turned out to be higher than the forecast values (638,000 -600,000), while the unemployment rate fell from 7.9% to 6.9% in October. In principle, these two reports should have been enough for the US dollar to at least slightly rise against the euro. However, market participants were so carried away by the topic of the US presidential election that they did not pay attention to any statistics. As a result, the dollar continued to fall on Friday. However, over the weekend it became known that Joe Biden did win the election, although there are still no final statistics for all states. It's just that Biden's gap from Trump is so large at the moment that the incumbent president no longer has a chance to win back at the expense of the remaining unaccounted votes. Therefore, we believe that the markets should now calm down a bit and the US dollar should start to rise. No macroeconomic reports from the US and the EU on Monday.
We have two trading ideas for November 9:
1) Buyers need to overcome the 1.1886-1.1912 area in order to start opening new buy positions on the pair with the nearest targets at the resistance levels of 1.1936 and 1.2011. If this condition is not met, then at least a downward correction will begin, and, even more so, a new downward trend. Take Profit in this case can range from 20 to 90 points.
2) Bears need to keep the pair below the 1.1886-1.1912 area, only then will it be possible to open short positions while aiming for 1.1791 and the Senkou Span B line (1.1733). Short positions are recommended in small lots, since the price is above the critical line of the Kijun-sen. Take Profit in this case can range from 70 to 130 points.
Hot forecast and trading signals for GBP/USD
Explanations for illustrations:
Support and Resistance Levels are the levels that serve as targets when buying or selling the pair. You can place Take Profit near these levels.
Kijun-sen and Senkou Span B lines are lines of the Ichimoku indicator transferred to the hourly timeframe from the 4-hour one.
Support and resistance areas are areas from which the price has repeatedly rebounded off.
Yellow lines are trend lines, trend channels and any other technical patterns.
Indicator 1 on the COT charts is the size of the net position of each category of traders.
Indicator 2 on the COT charts is the size of the net position for the "non-commercial" group.