Bitcoin has reached an all-time high during its rally. Currently, it is extremely difficult to predict entry points as the signals visible on horizontal charts indicate correctional movements. Despite the clear trajectory of the price, it is important to conduct a technical analysis to predict possible price swings and sell-off.
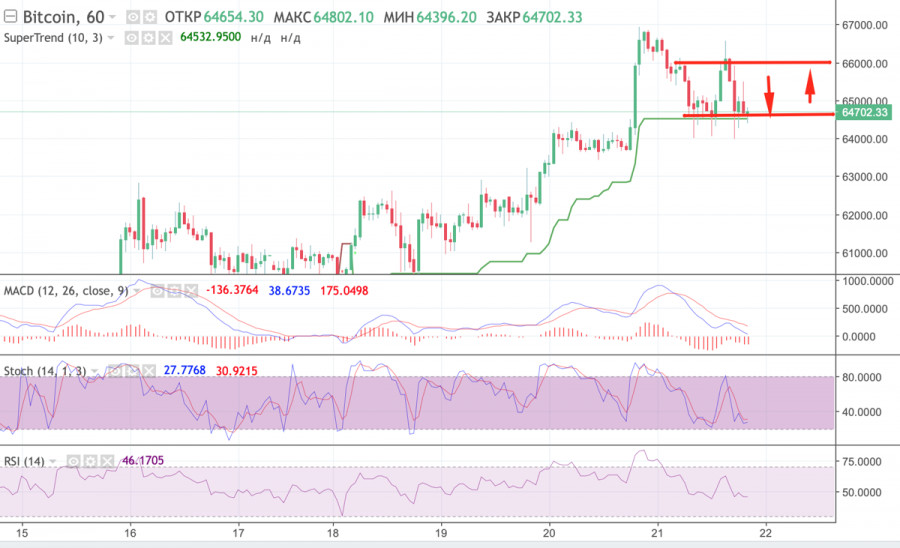
Yesterday, bitcoin has reached a new all-time high near $67,000. After that, it slowed down and stabilized. As of 17:00, BTC was trading around $63,500, indicating a decline in bullish momentum. This is quite a predictable reversal after rapid growth. During a rally, temporary slowdowns and correctional zones are the main entry points. Bitcoin is trying to reach the support area around $64,000-$65,500. Yet, the digital asset may decline even lower. To determine the lower border where the price may stabilize (concurrently the entry point), it is necessary to conduct a technical analysis of bitcoin. It helps to find out when the asset may resume the upward movement.
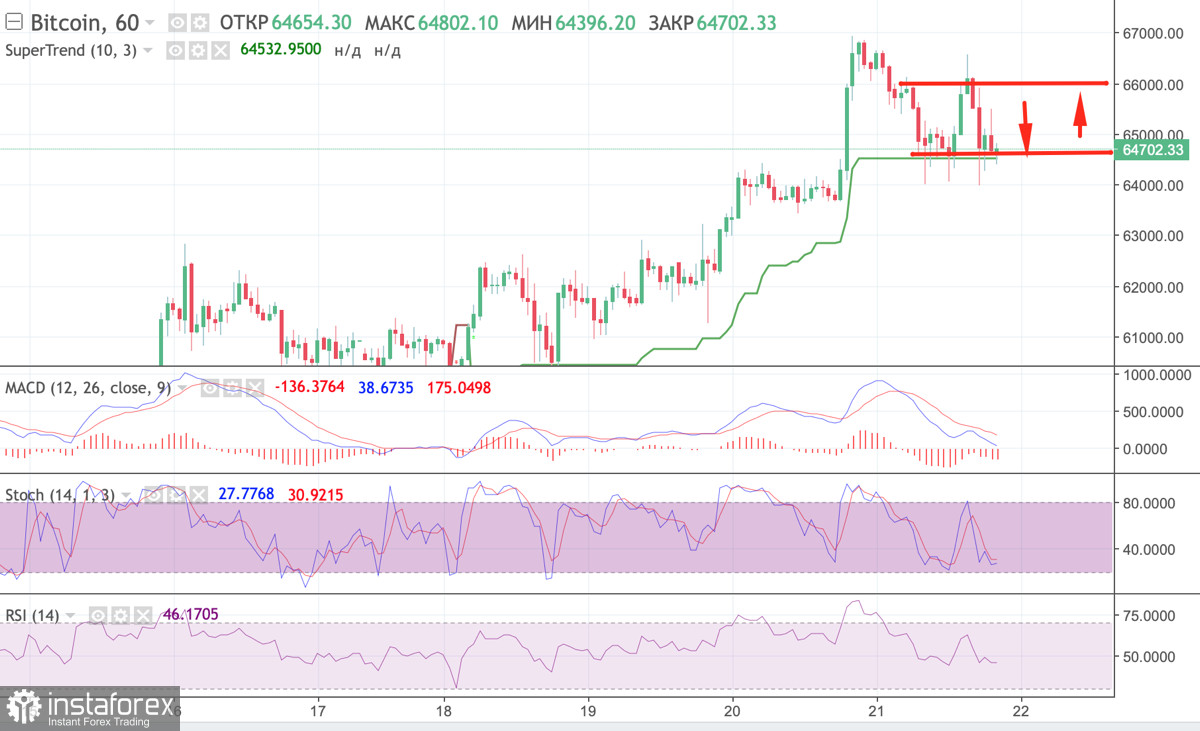
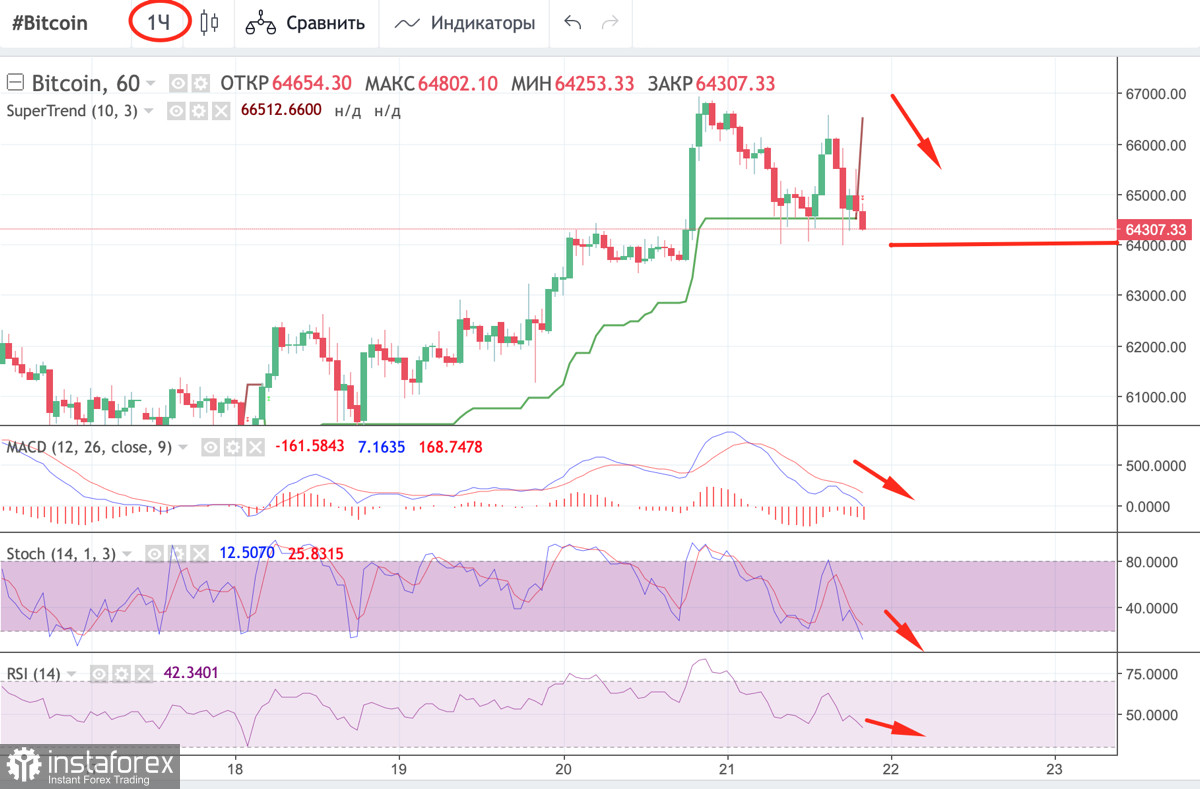
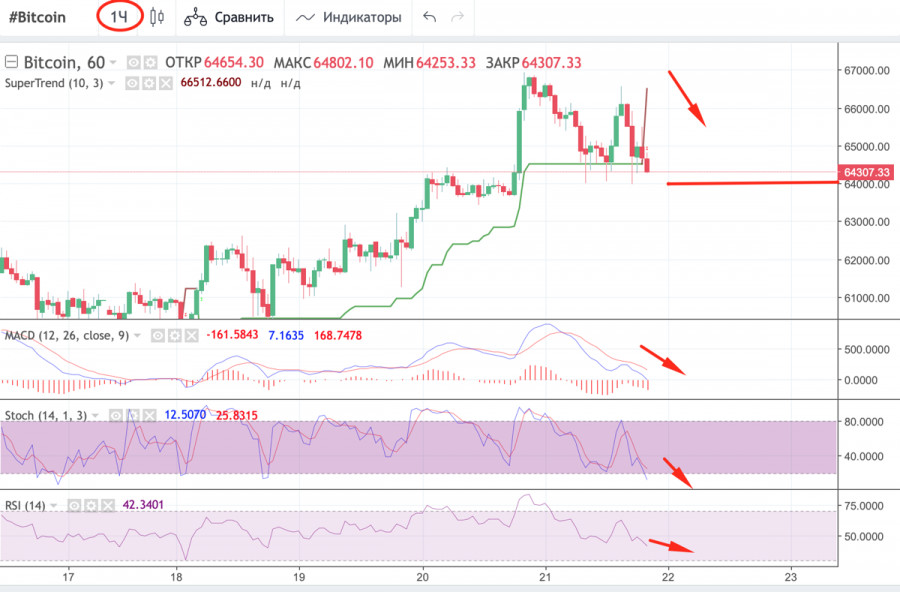
On the 1H chart, BTC broke below the super trend line. Technical indicators nosedived as well. The period of price stabilization is accompanied by increased bearish pressure. On larger timeframes, this may indicate a trend reversal and a retest of the support zones. On the 1H chart, the MACD indicator has made a bearish crossing. It keeps declining, approaching the red zone and the zero level. The stochastic oscillator also signals the weakness of bullish momentum, decreasing below the 40 level. The RSI indicator shows a similar dynamic, declining below 50. The 1H chart signals a trend change as bears seem to have asseted strength. If the price continues to decline, it is likely to find an entry point below $64,000.
The MVRV (Market Value to Realized Value) indicator displays the ratio of the market and realized the value of a particular cryptocurrency. This indicator gives a clearer picture of the current level of the coin and the trend. It also provides the results of movements. If the reading is below 0, then traders incurred losses. If the indicator is above 0, then investors made a profit.
The RSI indicator is a technical indicator that helps traders to determine the strength of a trend (descending or ascending) and foresee possible changes in the price movement. By using this indicator, traders may determine at what level an asset may enter an overbought or oversold zone. If the indicator is located at the level of 60, it signals a bullish trend, high demand for the coin, and the strength of the current upward momentum. If the indicator is located below this level, BTC begins to move to the overbought zone.
MACD (index of convergence/divergence of moving averages) is an indicator that helps traders discern the trend based on the movement of moving averages and values between them. The bullish signal is the intersection of the white line under the red and bearish. On the contrary, when the white line from above crosses the red line, it indicates a downward movement.
Stochastic (stochastic oscillator) indicates the strength of the momentum of the current prevailing trend. If the indicator is above the 80 level, then the asset can be considered overbought. If the stochastic is below 20, then the asset is in the oversold zone.
The super trend line is a technical indicator reflecting a bullish (green - a buy signal) and bearish (red - a sell signal) trend on the horizontal charts.
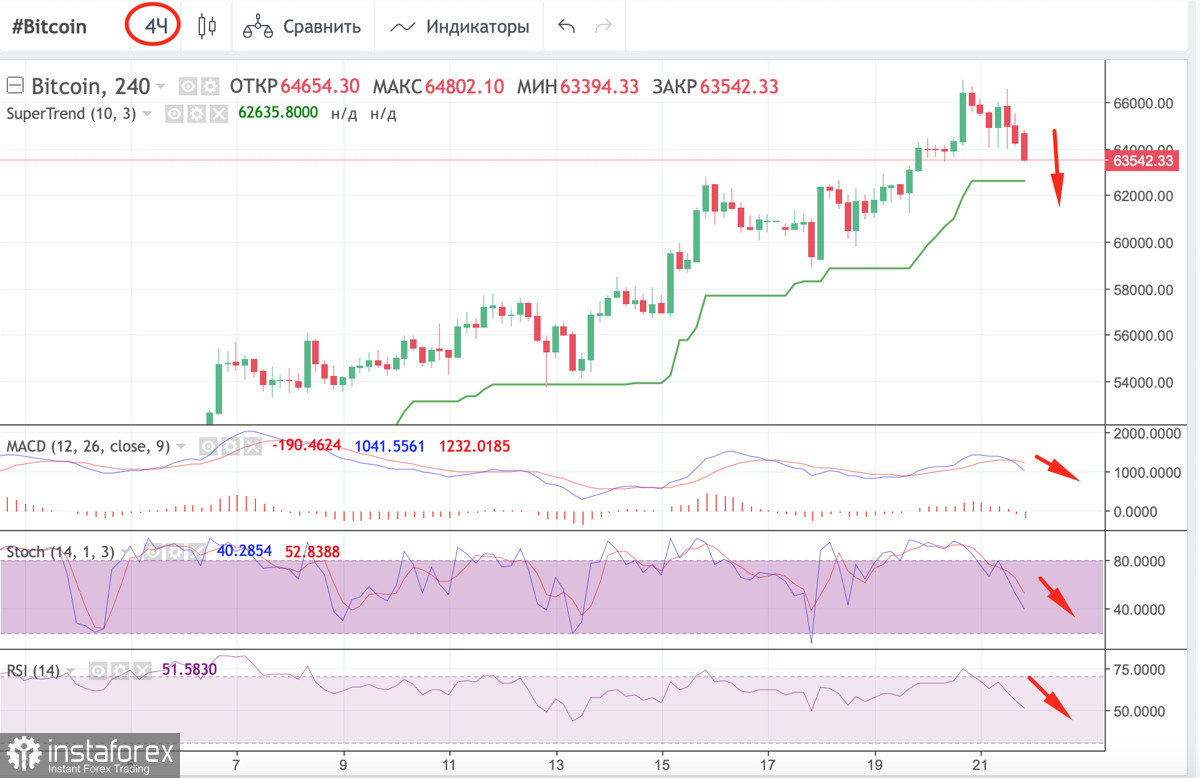
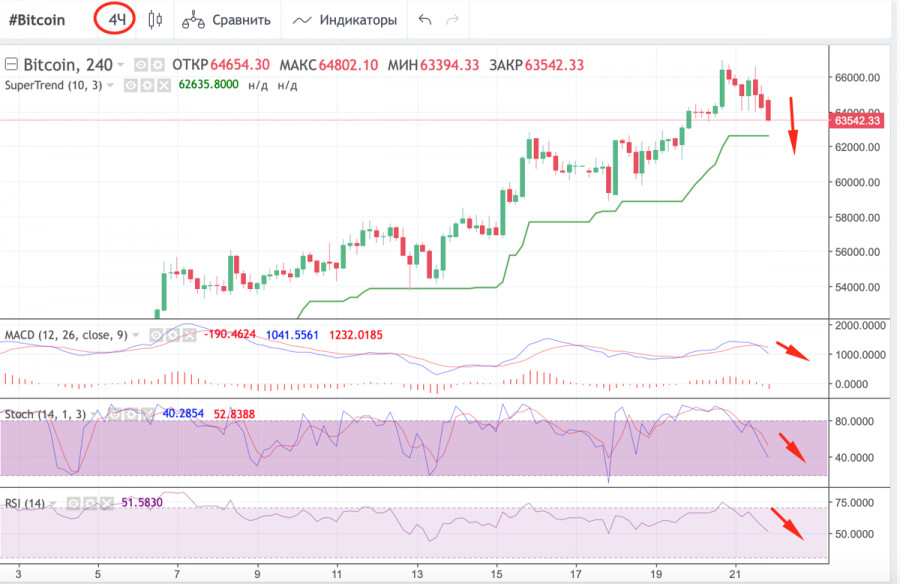
On the 4H chart, the price is unable to reach the super trend line but technical indicators continue to decline. Three bearish candlesticks have been formed. Bulls need to assert strength. Otherwise, there is every reason to believe that the number of short positions will continue to grow and the price will fall below the super trend line. This scenario is very likely, given that the MACD has formed a bearish intersection. It is starting to decline in parallel with the price. Stochastic and the RSI indicator are also dropping. It signals the weakness of bullish momentum. The price may rebound above $64,000 if the quotes break through the super trend line on the 4H chart. Therefore, it is recommended to open long positions at the $63,100 level.
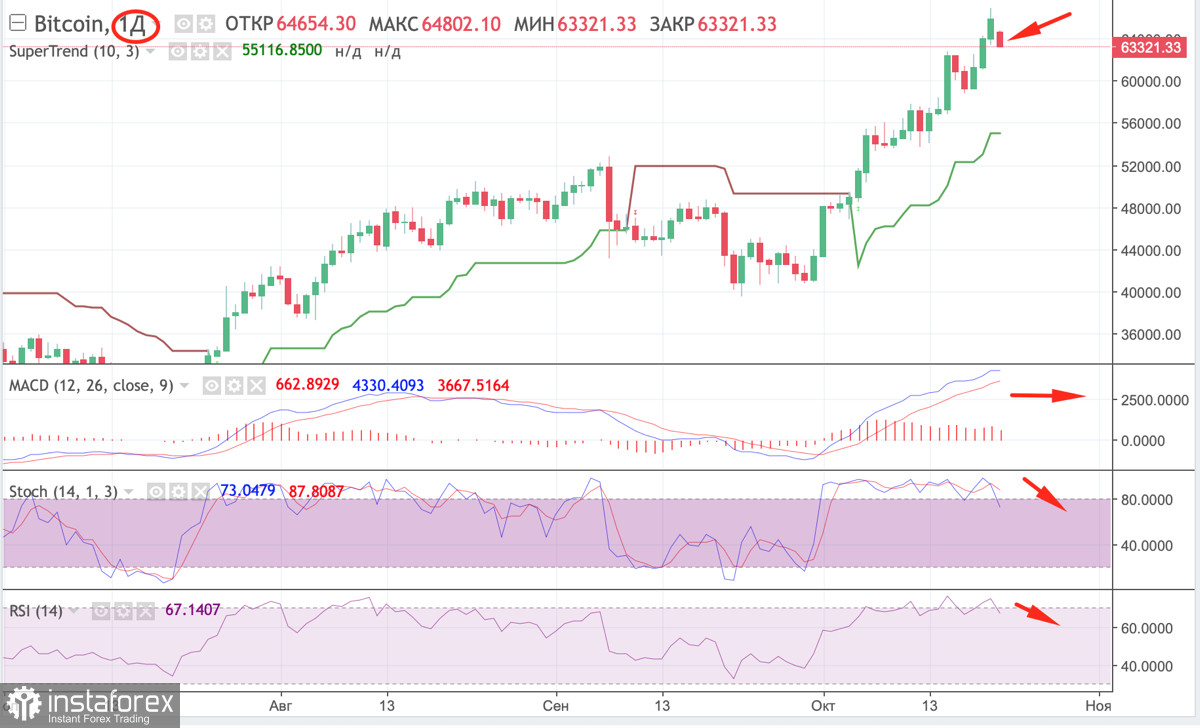
On the daily chart, the price has also started to decline. Technical indicators show bearish signals. Stochastic continues to drop after the formation of a bearish intersection. The RSI indicator has fallen below 60. At the same time, the MACD is moving sideways. However, it may also dip due to the increasing bearish pressure. The price may rebound to the $63,000 level. At this level, it is recommended to open long positions on BTC. However, there is a possibility that the price will decline to the key support level around $59,700. It is very risky to open short positions at this level due to a high likelihood of a rebound at $63,000-65,000. So, the $63,000 level is an excellent entry point for BTC.