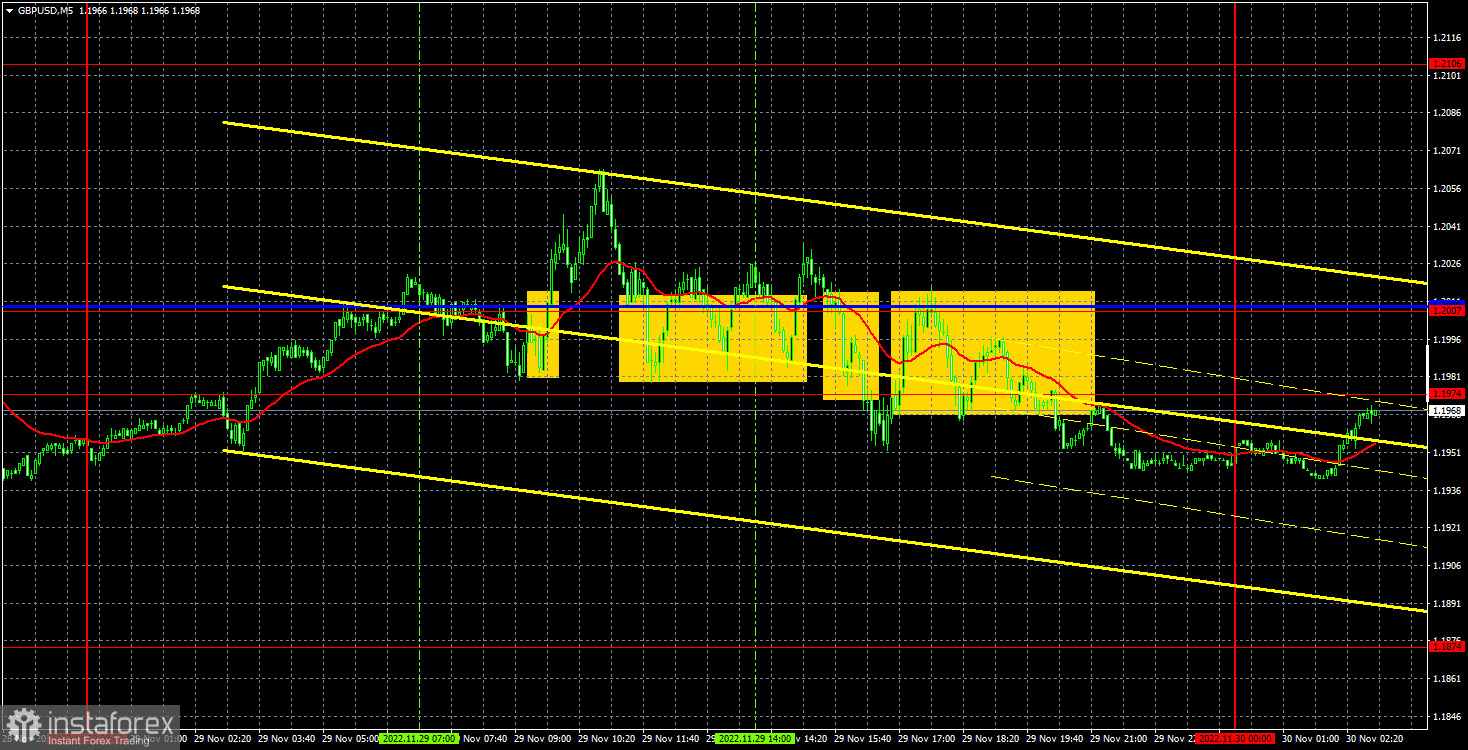
M5 chart of EUR/USD
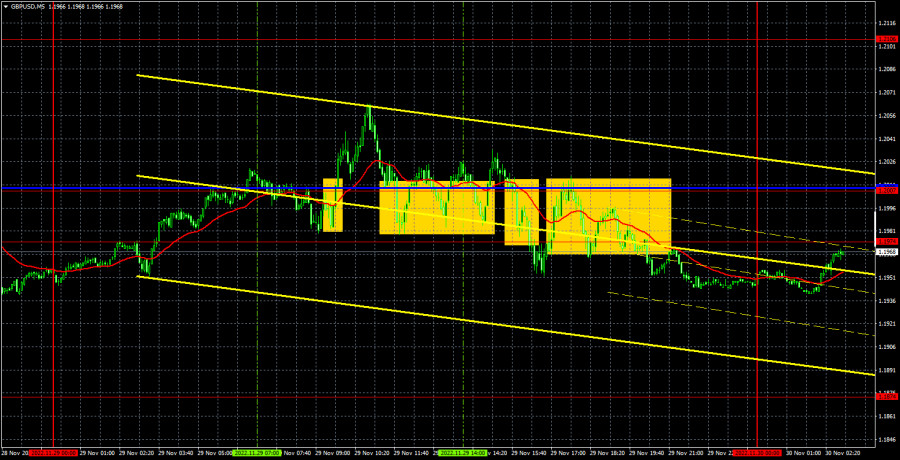
Yesterday, the euro/dollar pair showed quite strange movements. To be more precise, the movements were quite logical, since there were no important events. Therefore, the flat was quite predictable. But at the same time, there were not so many important macroeconomic and fundamental events either on Monday, and yet the pair still grew by 150 points and went down by the same amount. That is why the "roller coaster" started a flat, and such a move was not profitable. Nevertheless, the pair as a whole continues to correct against an uptrend, but the movement is still sluggish and uncertain. The price can settle below the important Senkou Span B line very soon, which can considerably increase the probability of further declines. Recall that we keep expecting a strong bearish correction, which still hasn't started. The price has already moved below the trend line and crossed the critical line, but traders are still not in a hurry to buy the dollar. Probably waiting for the Nonfarm data or Federal Reserve Chairman Jerome Powell's speech.
As for trading signals, the situation was such that there was no point in putting it on the chart. The pair spent almost the entire day in the 1.0340-1.0366-1.0393 range (Kijun-Sen). These three levels should be considered as a range, since the distance between them did not exceed 30 pips. The pair tried to settle below this area during the US session, but by that time it was clear that the market was flat.
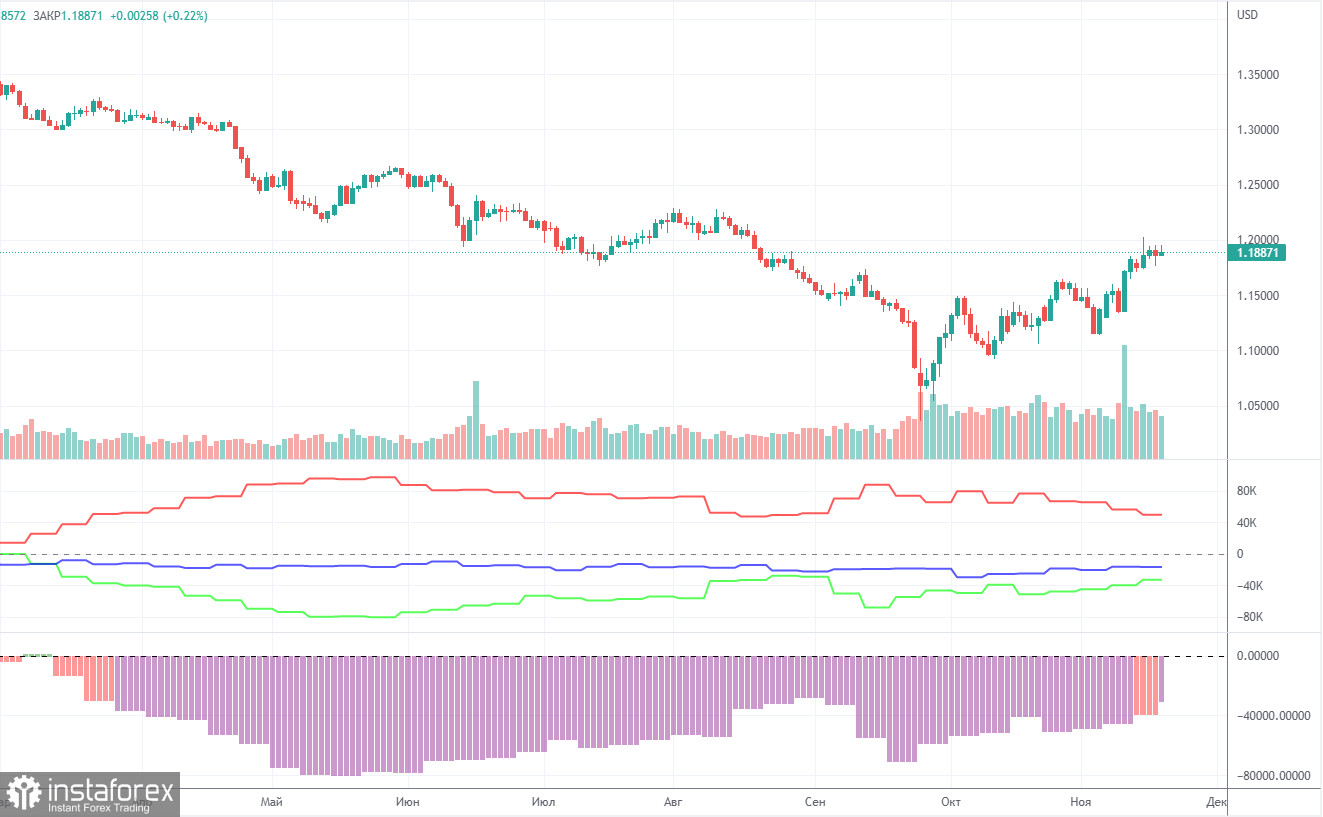
COT report
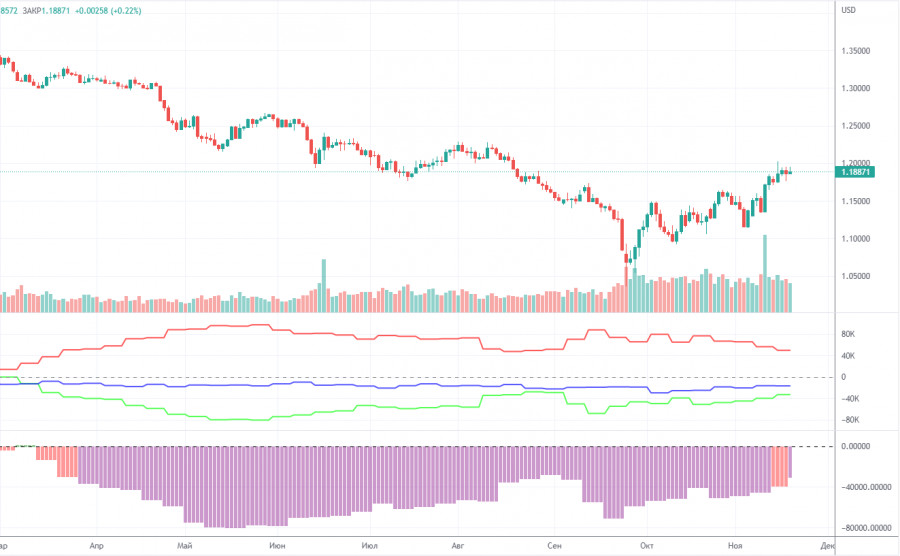
As for Commitment of Traders (COT) reports in 2022, they reflected bullish sentiment in the first six months of the year although the euro was bearish. Then, they illustrated bearish sentiment for several months with the euro being also bearish. Currently, the net position of non-commercial traders is again bullish and increasing. Meanwhile, the euro has hardly retreated from its 20-year lows. This is due to the fact that demand for the greenback is high amid a difficult geopolitical situation in the world. Therefore, despite a rise in demand for the euro, buoyant demand for the dollar does not allow the euro to strengthen. During the reporting week, the number of long positions held by non-commercial traders rose by 7,000 and that of short positions increased by 2,000. Consequently, the net position advanced by 5,000. The euro's recent growth is gradually coming in line with the figures illustrated in the COT report. Still, the greenback may resume growth under the influence of geopolitical factors or the lack of factors for further strengthening in the euro. The green and red lines of the first indicator moved far away from each other, which may indicate the end of the uptrend. The number of long positions exceeds that of short positions by 113,000. Therefore, the net position of non-commercial traders may continue to rise further, but without triggering a similar rise in the euro. When it comes to the total number of longs and shorts across all categories of traders, there are now 39,000 more short positions (635,000 vs 596,000).
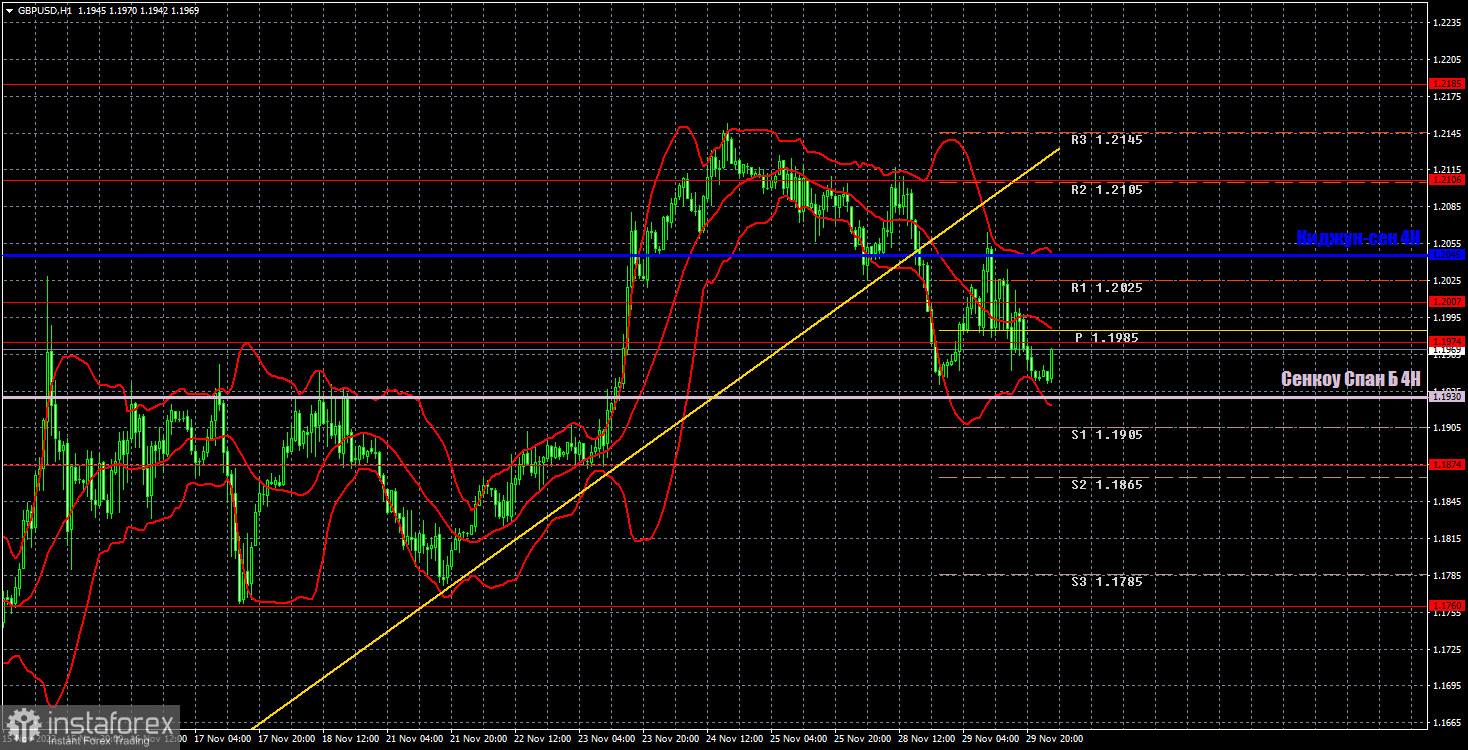
H1 chart of EUR/USD
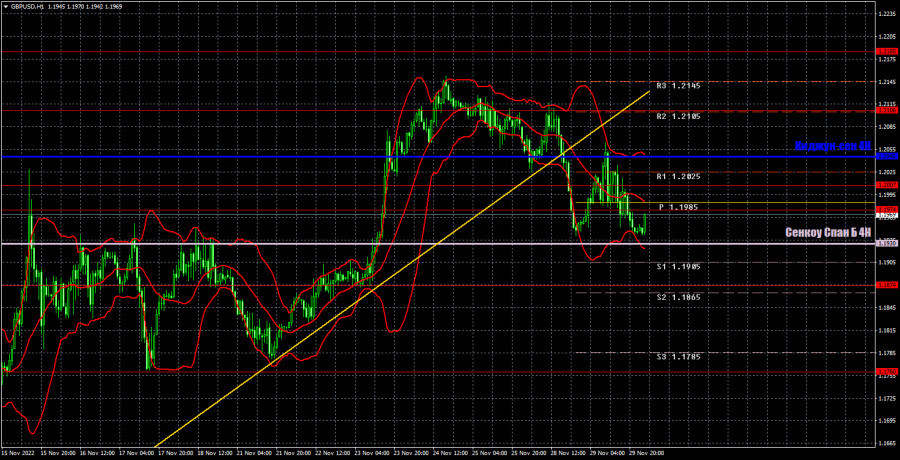
Lately, EUR/USD has shown absolutely inadequate movements on the one-hour chart. It still hasn't started a downward movement even after it crossed the ascending trend line. Yesterday, the pair updated its last local high, but failed to break through the important level of 1.0485. And now it may start a strong bearish correction, which we already expected a week ago. On Wednesday, the pair may trade at the following levels: 1.0124, 1.0195, 1.0269, 1.0340-1.0366, 1.0485, 1.0579, 1.0637, as well as Senkou Span B lines (1.0351) and Kijun Sen (1.0407). Lines of the Ichimoku indicator may move during the day, which should be taken into account when determining trading signals. There are also support and resistance levels, but signals are not formed near these levels. Bounces and breakouts of the extreme levels and lines could act as signals. Don't forget about stop-loss orders, if the price covers 15 pips in the right direction. This will prevent you from losses in case of a false signal. On November 30, we can look forward to the following reports: the EU inflation data for November, which is quite significant, and in America, we have GDP and ADP reports, as well as Powell's speech. Therefore, we have a good amount of important events today.
What we see on the trading charts:
Price levels of support and resistance are thick red lines, near which the movement may end. They do not provide trading signals.
The Kijun-sen and Senkou Span B lines are the lines of the Ichimoku indicator, moved to the one-hour chart from the 4-hour one. They are strong lines.
Extreme levels are thin red lines from which the price bounced earlier. They provide trading signals.
Yellow lines are trend lines, trend channels, and any other technical patterns.
Indicator 1 on the COT charts reflects the net position size of each category of traders.
Indicator 2 on the COT charts reflects the net position size for the non-commercial group.