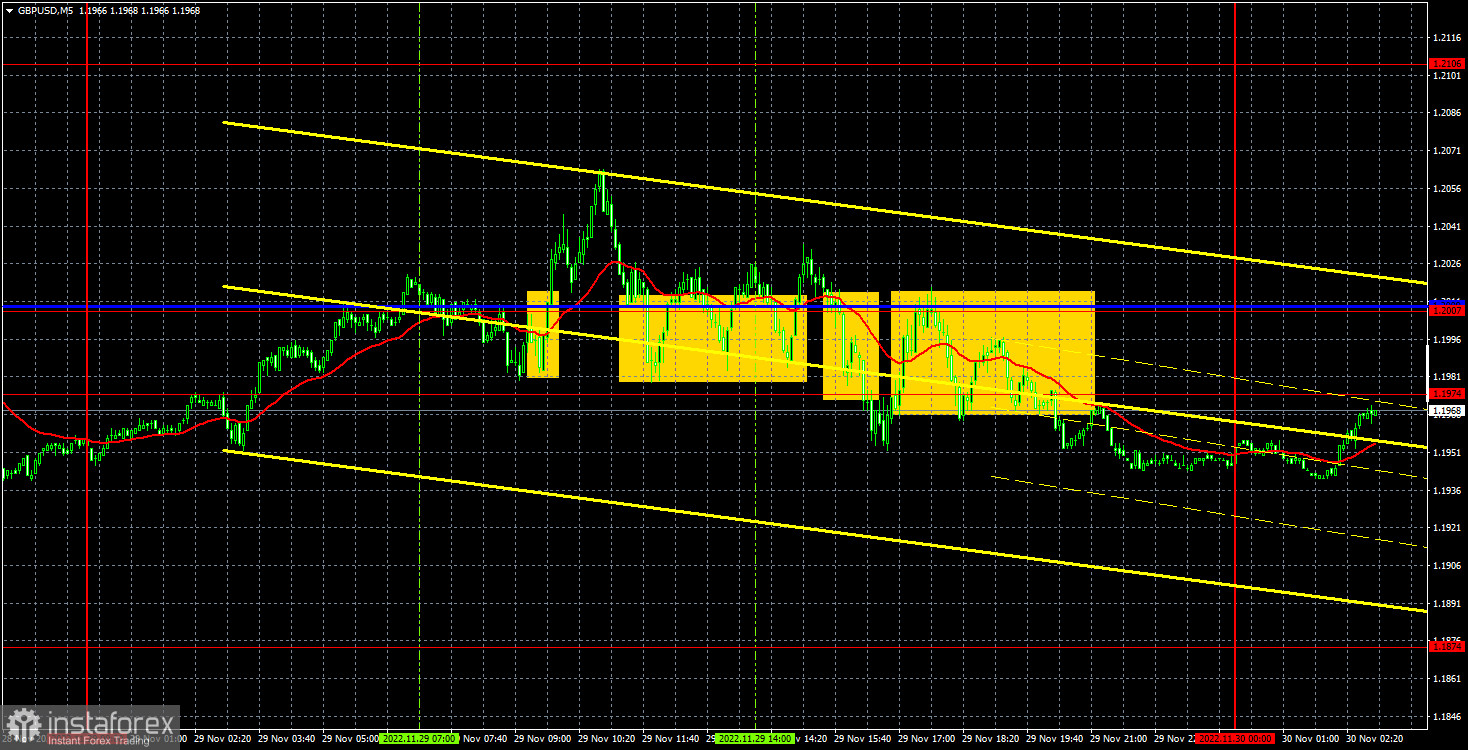
M5 chart of GBP/USD
Yesterday, GBP/USD struggled to continue its downward movement after crossing the ascending trend line, but spent the entire day between the Senkou Span B and Kijun Sen lines. So technically we have a bearish correction, but it is very weak and inconclusive. Nevertheless, I still expect the dollar to significantly strengthen, which would be logical from a technical perspective. But important data will be released today, which might change traders' sentiment from bearish to bullish. For instance, Federal Reserve Chairman Jerome Powell's speech might well keep the dollar from strengthening further. But I still expect the pound to fall further, since it has grown too much recently. Now I'm waiting for the quote to cross the important Senkou Span B line, which will open the way for the pound to fall further.
Although the pound was not in a classic flat on Tuesday, the character of the movement was such that it would be better for traders not to enter the market on that day. The pair moved between 1.1974 and 1.2007, which is considered a range but at the same time the price was regularly moving above and below this area. This is why there were plenty of signals, but the pair was never able to approach any of the target levels. The first buy signal appeared during the European session, so at least losses were avoided, as the price moved up more than 20 pips making it possible to place the Stop Loss without getting a loss. Then several more signals for long positions were formed, and the loss was almost inevitable. All subsequent signals around this area should not be processed since the first few signals were false.
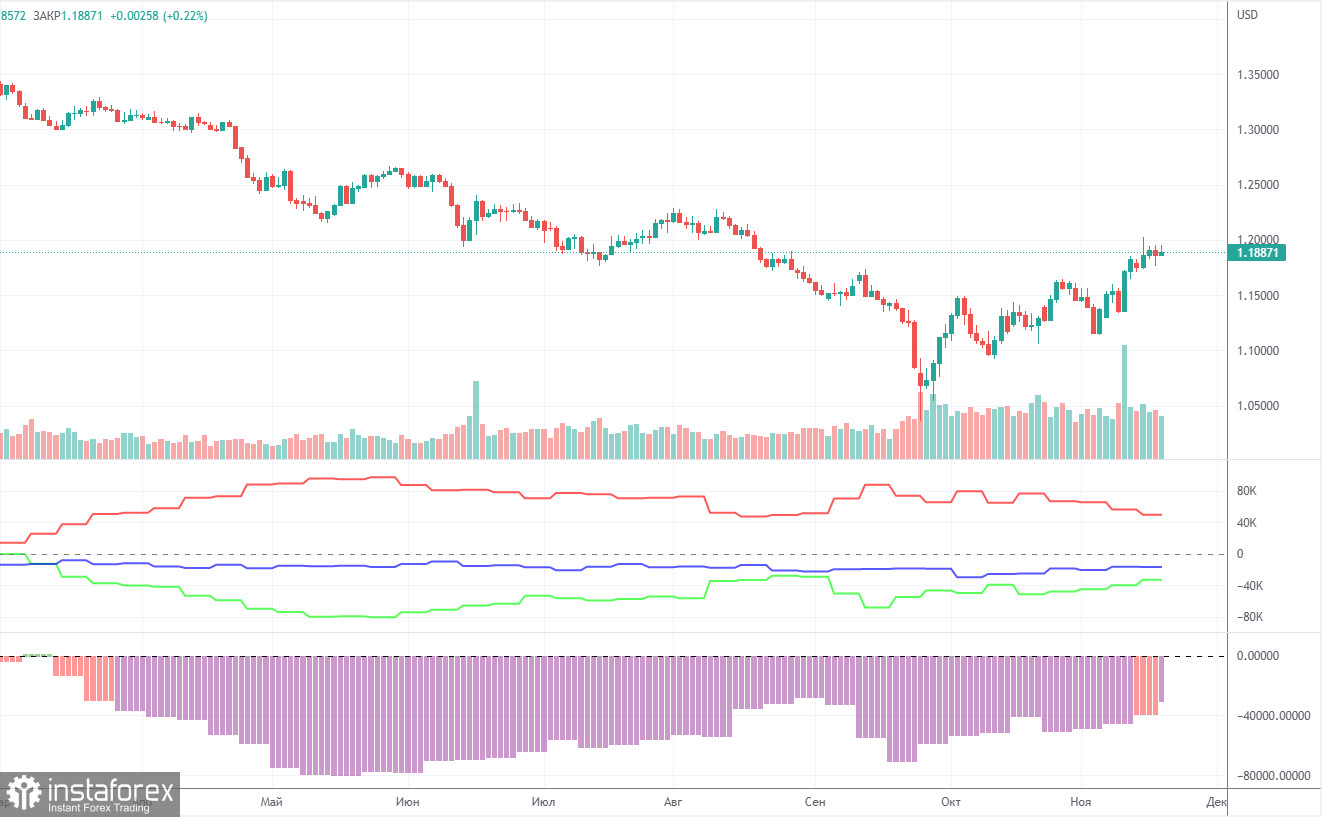
COT report
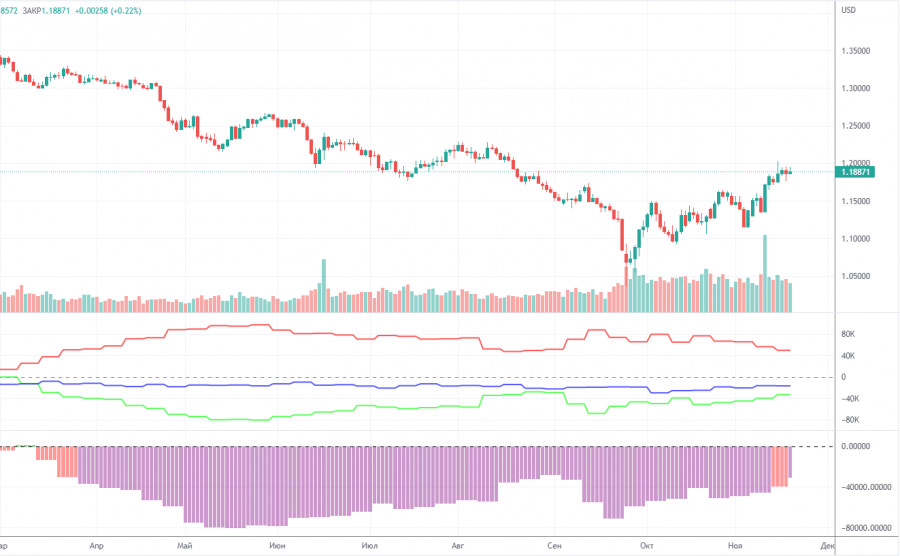
The latest Commitment of Traders (COT) report on GBP logged a slight decrease in bearish sentiment. In the given period, the non-commercial group closed 1,900 long positions and 8,800 short positions. Thus, the net position of non-commercial traders increased by 7,000. The net position is gradually growing during the last months, but the sentiment of the big players is still bearish. The pound has been rising in recent weeks, but so far it does not seem that it is preparing for a long-term uptrend. And, if we remember the euro's situation, then based on the COT reports, we can hardly expect a surge in price. The demand for the US currency remains very high, and the market, as it seems, is just waiting for new geopolitical shocks so it can return to buying the dollar. The non-commercial group now has a total of 67,000 shorts and 34,000 longs opened. As we can see, there is a wide gap between them. As it turns out the euro is now unable to show growth when market sentiment is bullish. When it comes to the total number of long and short positions, here bulls have an advantage of 17,000. Still, this is not enough for the sterling to increase. Anyway, we are still skeptical about the pound's long-term growth although the technical picture shows otherwise.
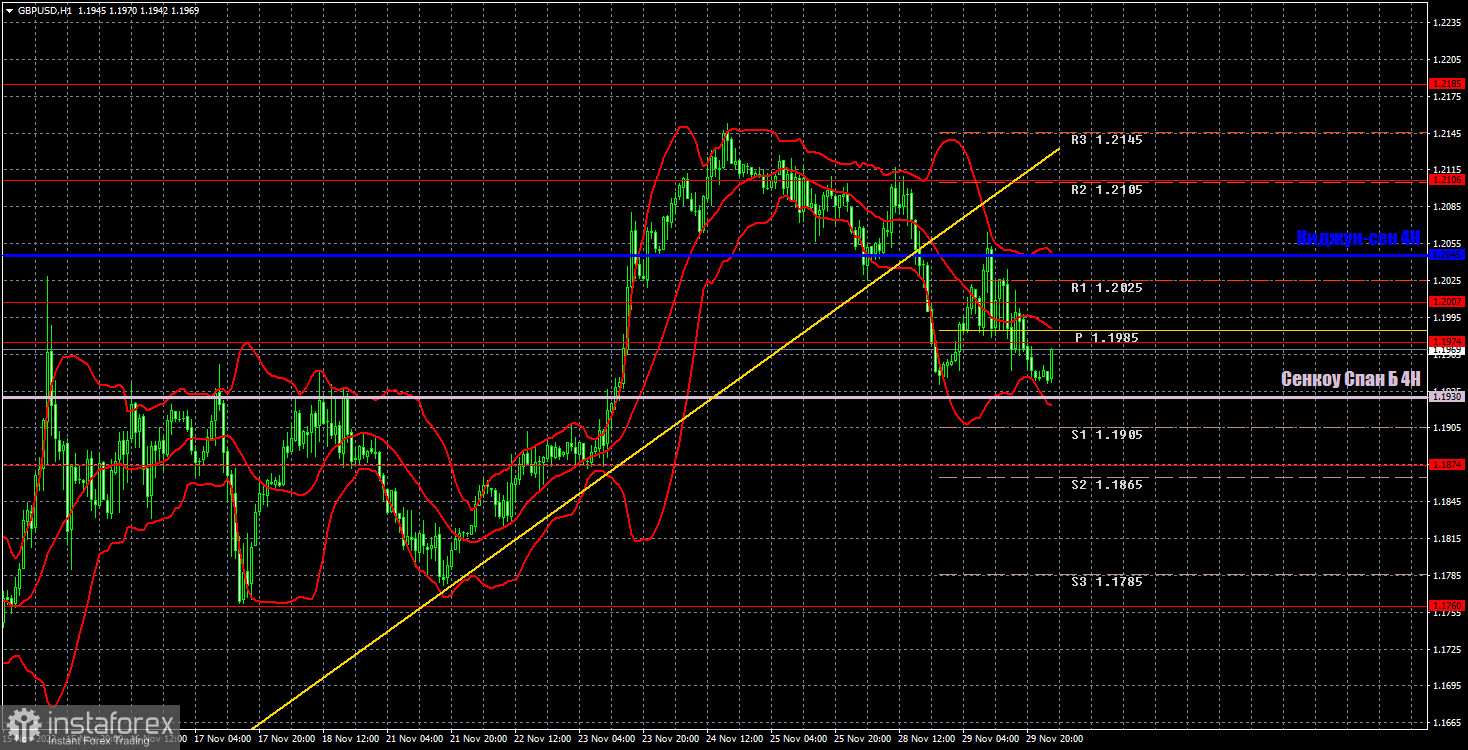
H1 chart of GBP/USD
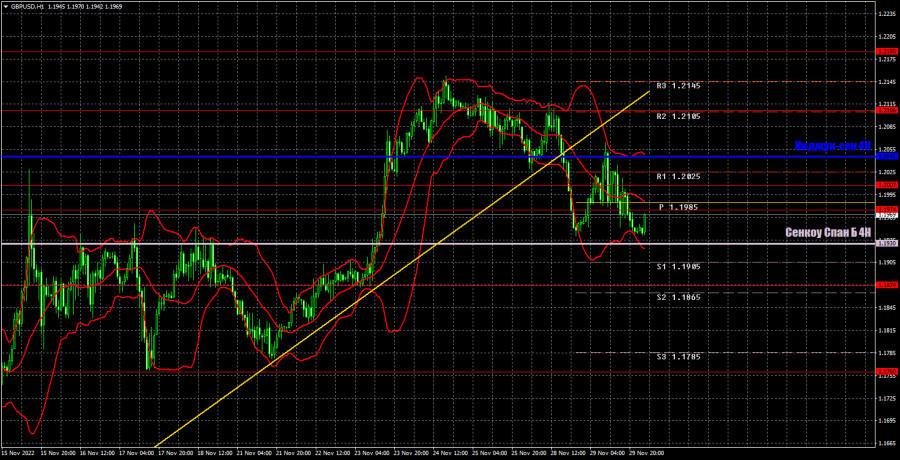
The pair started moving down on the one-hour chart, which we have been waiting for. It has crossed the trend line, so the uptrend is officially canceled. I believe that the pound may show a solid decline in the near future, but for now it needs to break through at least the Senkou Span B line and hope for support from this week's fundamental background. On Wednesday, the pair may trade at the following levels: 1.1760, 1.1874, 1.1974-1.2007, 1.2106, 1.2185, 1.2259. Senkou Span B (1.1930) and Kijun Sen (1.2045) lines may also generate signals. Pullbacks and breakouts through these lines may produce signals as well. A Stop Loss order should be set at the breakeven point after the price passes 20 pips in the right direction. Ichimoku indicator lines may move during the day, which should be taken into account when determining trading signals. In addition, the chart does illustrate support and resistance levels, which could be used to lock in profits. On Wednesday, there are no important events or reports for the UK, but there will be important reports in the US and also a speech from Powell. Therefore, volatility and trend movement could be quite strong today.
What we see on the trading charts:
Price levels of support and resistance are thick red lines, near which the movement may end. They do not provide trading signals.
The Kijun-sen and Senkou Span B lines are the lines of the Ichimoku indicator, moved to the one-hour chart from the 4-hour one. They are strong lines.
Extreme levels are thin red lines from which the price bounced earlier. They provide trading signals.
Yellow lines are trend lines, trend channels, and any other technical patterns.
Indicator 1 on the COT charts reflects the net position size of each category of traders.
Indicator 2 on the COT charts reflects the net position size for the non-commercial group.