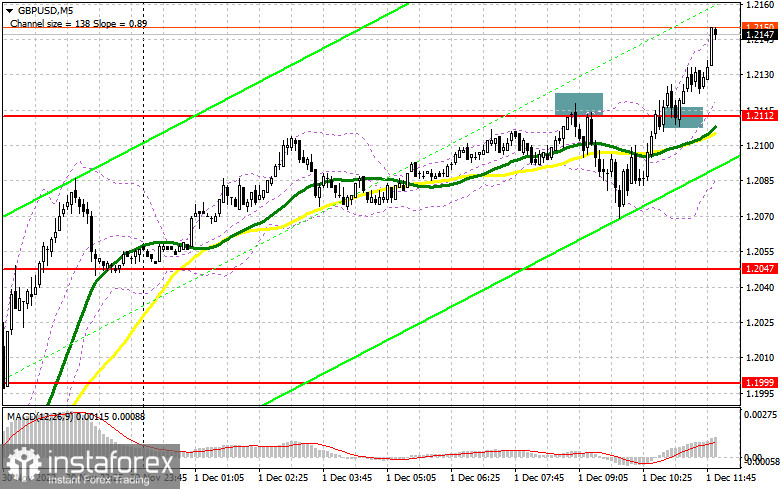
In my previous analytical review, I drew your attention to the level of 1.2112 and recommended entering the market from it. Let's have a look at the 5-minute chart and analyze the situation there. The pair increased and formed a false breakout at 1.2112. This allowed bears to take advantage of the situation and drag the price down by 40 pips. After that, strong data on PMI was released and the price pierced 1.2112. The market received a good entry point into long positions. At the time of writing, the price soared by 30 pips.
Long positions on GBP/USD:
As long as the pair is trading above 1.2112, the bull market may continue and the British pound may surge to the area of 1.2179. Meanwhile, the market expects a lot of important releases on inflation during the North American session. Bulls will have to reconsider their plans If the Core PCE Price Index and Personal Spending show growth. If the pressure on the British currency returns, it would be better to act according to the following scenario: a false breakout at 1.2112, which now offers support, may give a signal to open long positions with the target at 1.2179. A breakthrough and downward test of this level may support bulls, creating a buy signal and allowing them to push the price to 1.2224. The next target is located at the monthly high of 1.2256, where traders may lock in profits. However, the price may get to this level only if the US statistics turn out to be weak, including the US labor market and the ISM Manufacturing PMI for November. Notably, weak performance is likely to make the recession closer. If bulls fail to reach above the level of 1.2112, the pressure on the pair may return. This is likely to trigger profit-taking in the market. In this case, it is better to buy GBP near the next support at 1.2047, where the moving averages are, which support bulls now. One may consider long positions on a rebound from 1.1999 or lower near 1.1954, allowing an intraday correction of 30-35 pips.
Short positions on GBP/USD:
The bears failed to protect 1.2112. Now they should defend 1.2179. The price is likely to rush towards this level in the afternoon. A false breakout at this level may create a good entry point into short positions with the target at 1.2112. If we see strong data on the US manufacturing activity index, the price is likely to drop below 1.2112. It is hard to say, what else can help the US dollar in the current environment. A downward test of 1.2112 would give a sell signal with the target at 1.2047, where bears will have to be active. The next target is located in the area of 1.1999, where one may take profit. If the British pound does not drop below the level of 1.2179, bulls are likely to continue to push the British currency higher, reaching the area of 1.2224. Only a false breakout at this level may create an entry point into short positions. If we see no activity at this level, it would be better to sell GBP on a rebound from 1.2256, allowing an intraday correction of 30-35 pips.
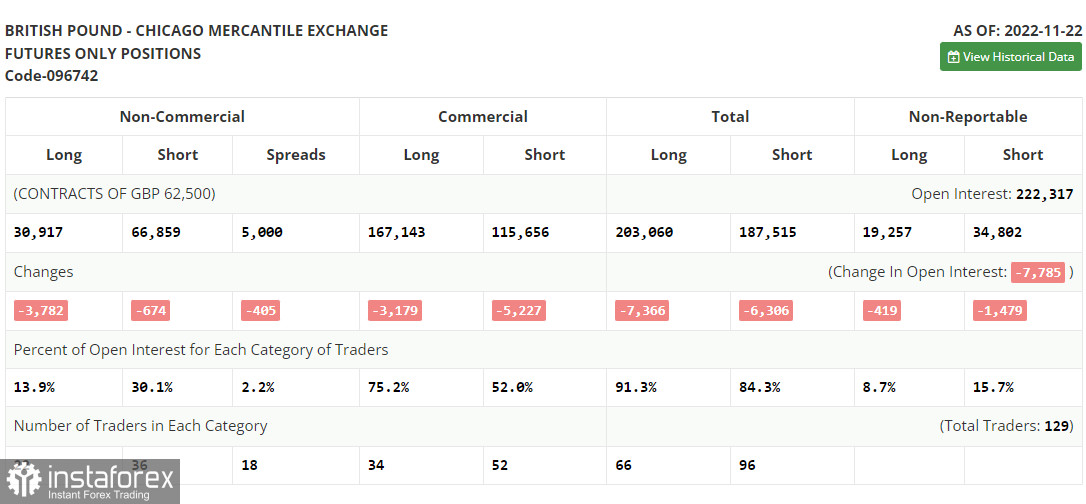
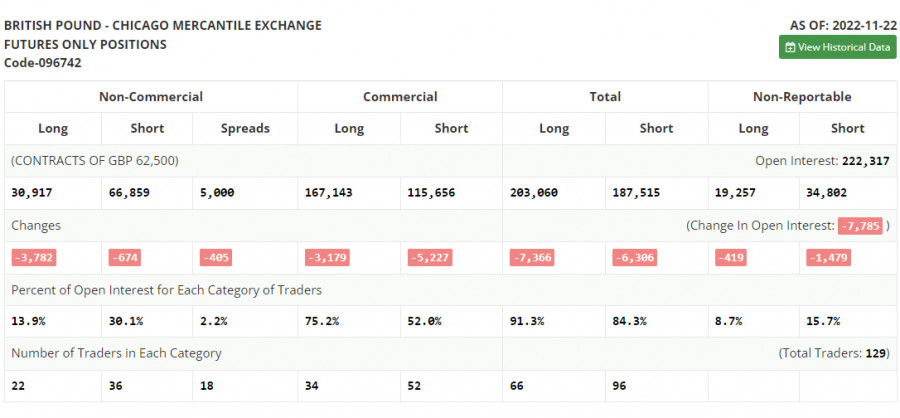
The COT report for November 22 logged a decrease in both short and long positions. The decline in the UK economy continues to signal the looming recession, which the Bank of England does not yet have much intention to fight. Firstly, it has to deal with high inflation. As shown the latest data shows, inflation continues to grow. Against this backdrop, it is not surprising why traders prefer to stay away from the market, neither buying nor selling the pound. This week, the Federal Reserve Chairman will share his views on the future of US monetary policy. If his statements do not match market expectations, the pressure on the British pound may come back immediately, triggering a large sell-off in the pair later this month and early next month. The latest COT report showed that long non-commercial positions declined by 3,782 to 30,917, while short non-commercial positions declined by 674 to 66,859, pushing the negative non-commercial net position to -35,942, versus -32,834 a week earlier. The weekly closing price rose to 1.1892, against 1.1885.
Indicator signals:
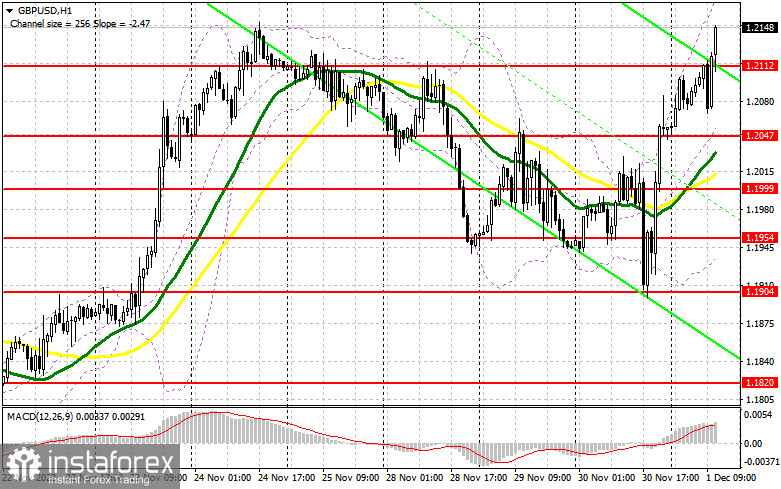
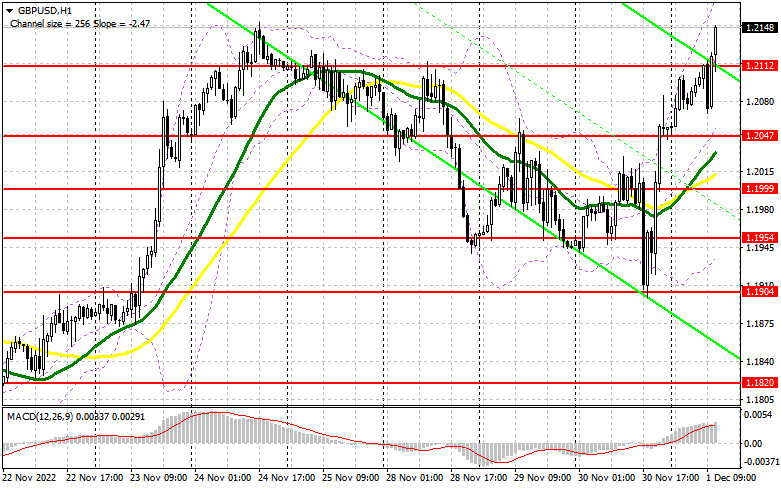
Moving Averages
Trading above the 30- and 50-day moving averages indicates a bull market.
Please note that the time period and levels of the moving averages are analyzed only for the H1 chart, which differs from the general definition of the classic daily moving averages on the D1 chart.
Bollinger Bands
In case of a decline, the lower band of the indicator at 1.1940 will offer support.
Description of indicators:
- A moving average of a 50-day period determines the current trend by smoothing volatility and noise; marked in yellow on the chart;
- A moving average of a 30-day period determines the current trend by smoothing volatility and noise; marked in green on the chart;
- MACD Indicator (Moving Average Convergence/Divergence) Fast EMA with a 12-day period; Slow EMA with a 26-day period. SMA with a 9-day period;
- Bollinger Bands: 20-day period;
- Non-commercial traders are speculators such as individual traders, hedge funds, and large institutions who use the futures market for speculative purposes and meet certain requirements;
- Long non-commercial positions represent the total number of long positions opened by non-commercial traders;
- Short non-commercial positions represent the total number of short positions opened by non-commercial traders;
- The non-commercial net position is the difference between short and long positions of non-commercial traders.