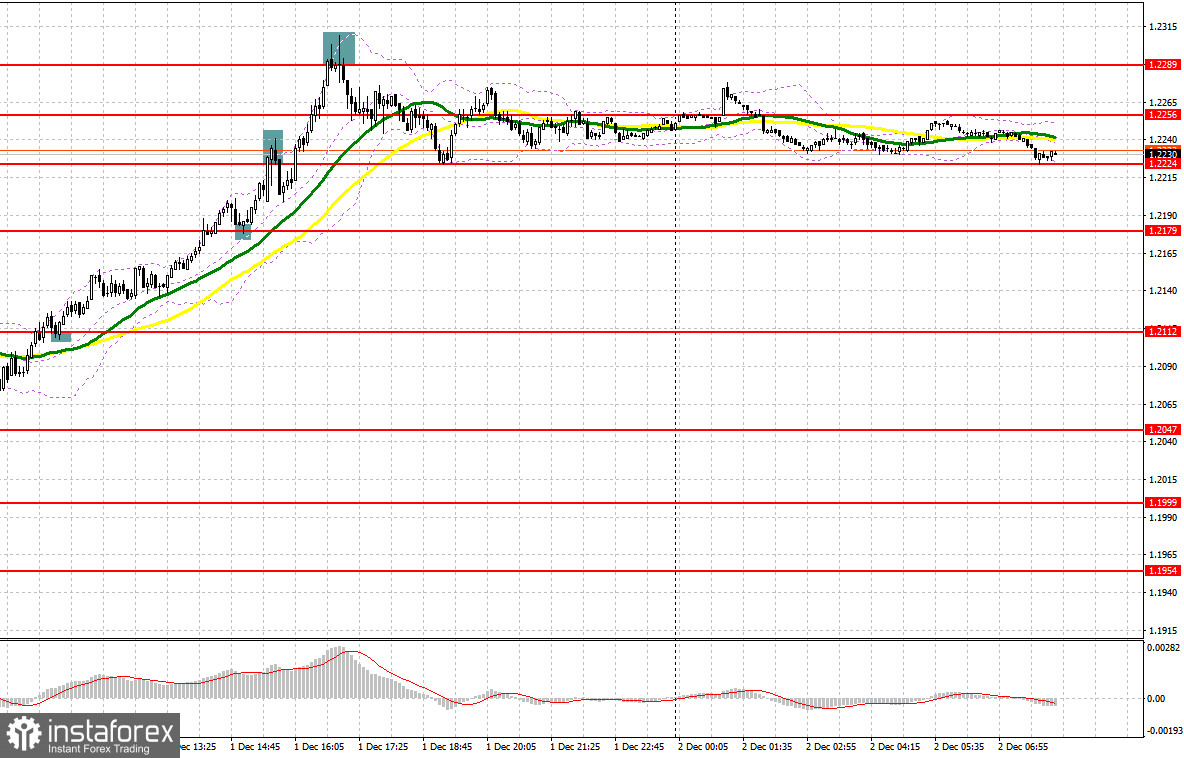
Yesterday, a few nice entry signals were made. Let's take a look at the M5 chart to get a picture of what happened. In the previous review, we focused on the mark of 1.2112 and considered entering the market there. Growth and a false breakout through 1.2112 produced a sell signal, and the price fell by 40 pips. Following the release of PMI data, traders broke through 1.2112. The price retested the level and a buy signal brought a profit of 70 pips. By the middle of the day, a retest at 1.2179 to the downside made another buy signal, and the quote went up by 45 pips. Selling after a false breakout at 1.2224 brought no profit while after a rebound at 1.2289, the quote rose by above 30 pips again.
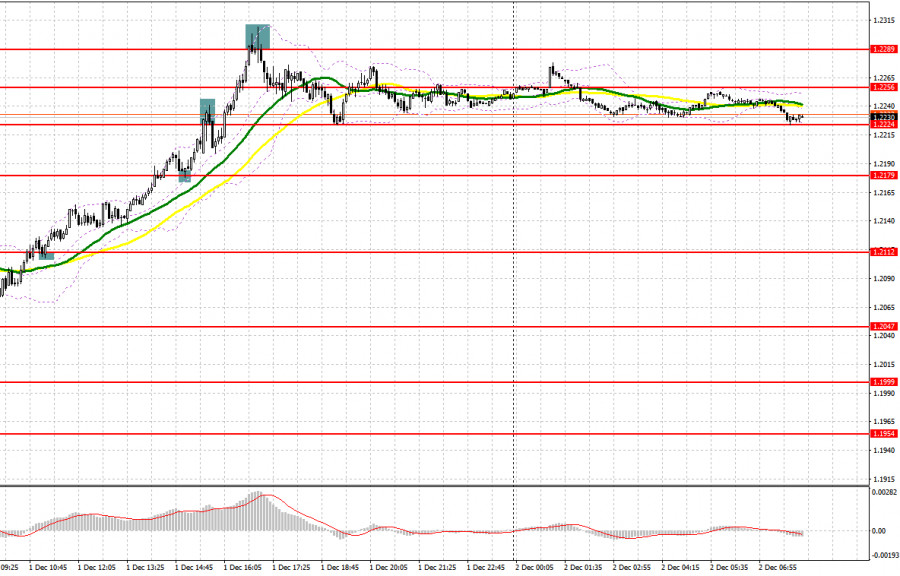
The disappointing PMI results in the US triggered a sell-off in the greenback. Today, the macroeconomic calendar will be empty in the first half of the day. Therefore, the pair is likely to trade in a sideways channel with a noticeable bullish bias, which will be especially felt at the time of any more or less significant correction. A false breakout through 1.2179 will make a buy signal with the target at 1.2245. It is important that the buyers break and consolidate above 1.2245 because that will allow them to extend the uptrend. After a downside test at 1.2245, the quote may rise to yesterday's high of 1.2302. If the price goes above this range, the trend will continue, with the target at 1.2347. The most distant target is seen in the area of 1.2393 where a profit-taking stage may begin. If the buyers fail and lose control over 1.2179, the pair may feel stronger pressure after the release of the US Labor market report, which may trigger a bearish correction. In such a case, it would be wiser to go long after a false breakout through 1.2112. Also, it will be possible to buy GBP/USD on a bounce off 1.2047, allowing a correction of 30-35 pips intraday.
When to go short on GBP/USD:
A correction may occur in the first half of the day. However, a bearish reversal will hardly take place any time soon. A buying stage will follow any major downward movement in the pound. Therefore, even strong nonfarm payrolls will hardly provide support for the currency today. In the first half of the day, the sellers should protect the level of 1.2245. A false breakout through the mark will make a sell signal with the target at the nearest support of 1.2179, which is in line with bullish MAs. A breakout and a retest of the level to the upside will make a sell signal, and the pair will fall to 1.2112. That will make trading difficult for the buyers who expect a continuation of the uptrend. The most distant target is seen at 1.2047, where a profit-taking stage may begin. If GBP/USD goes up when there is no bearish activity at 1.2245, the bulls will likely regain control over the market. A false breakout through the 1.2302 high will generate a sell signal. If there is no activity there, GBP/USD could be sold from the high and at 1.2347, allowing a bearish correction of 30-35 pips intraday.
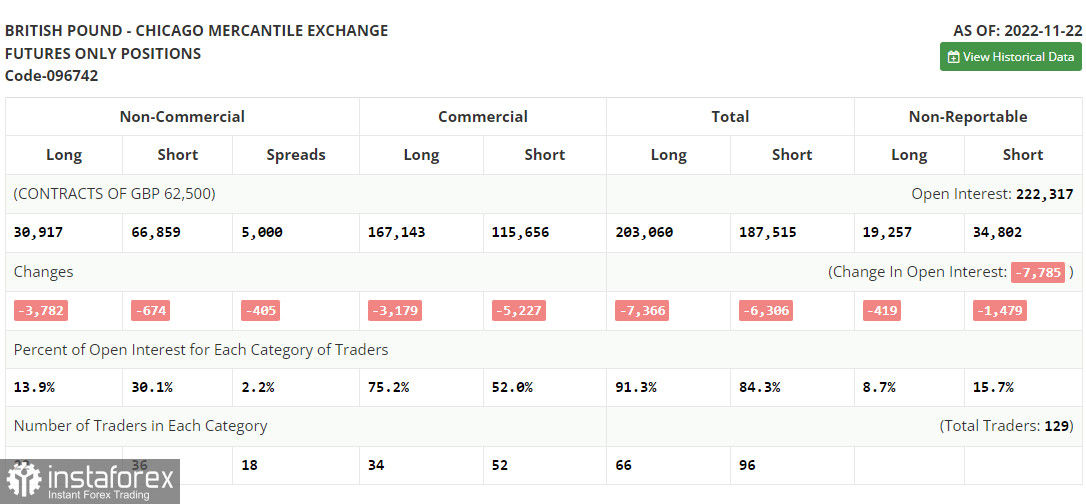
Commitments of Traders:
Commitments of Traders for November 22 reflect a decrease in both long and short positions. A decline in economic activity in the UK signals a recession. Meanwhile, the Bank of England is focusing on inflation, which remains stubbornly high. In this light, traders prefer staying away from the market, neither selling nor buying the pound. This week, the US Fed will real its monetary policy plans for next year. In case hawkish statements will come in line with market expectations, the pound will feel strong selling pressure which will cause a mass sell-off in early December. According to the latest COT report, long non-commercial positions dropped by 3,782 to 30,917 and short non-commercial positions decreased by 674 to 66,859, which led to a further increase in the negative non-commercial net position to -35,942 from -32,834 a week earlier. The weekly closing price of GBP/USD grew to 1.1892 against 1.1885.
Indicator signals:
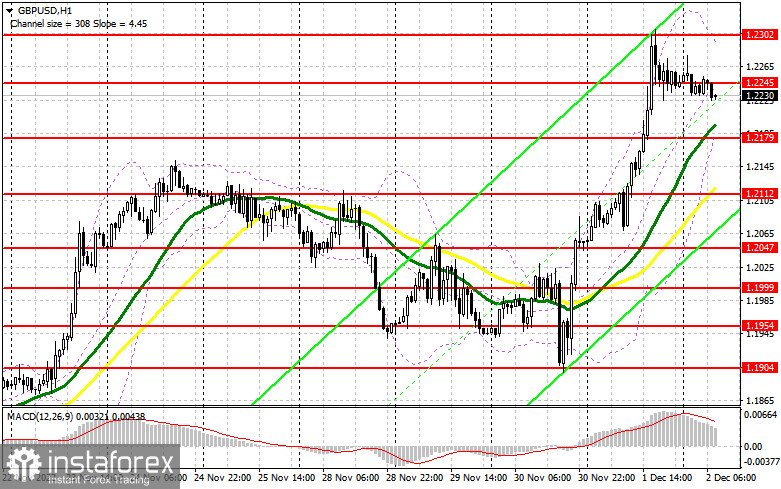
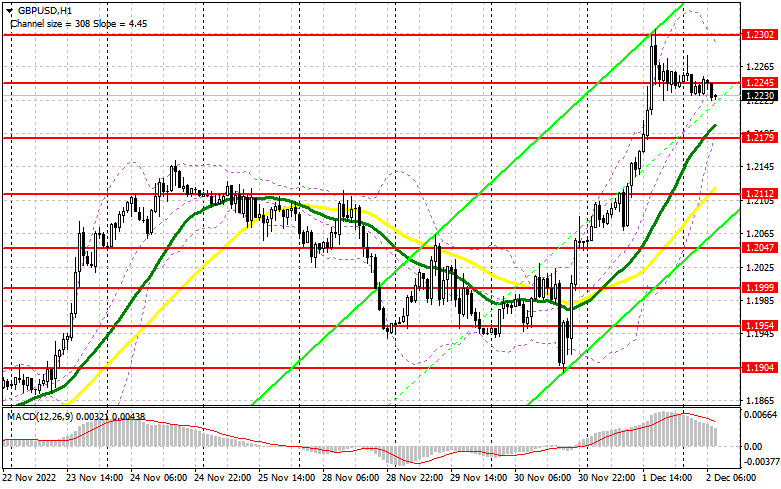
Moving averages
Trading is carried out above the 30-day and 50-day moving averages, signaling a continuation of the uptrend.
Note: The period and prices of moving averages are viewed by the author on the hourly chart and differ from the general definition of classic daily moving averages on the daily chart.
Bollinger Bands
Resistance is seen at 1.2302, in line with the upper band.
Indicator description:
- Moving average (MA) determines the current trend by smoothing volatility and noise. Period 50. Colored yellow on the chart.
- Moving average (MA) determines the current trend by smoothing volatility and noise. Period 30. Colored green on the chart.
- Moving Average Convergence/Divergence (MACD). Fast EMA 12. Slow EMA 26. SMA 9.
- Bollinger Bands. Period 20
- Non-commercial traders are speculators such as individual traders, hedge funds, and large institutions who use the futures market for speculative purposes and meet certain requirements.
- Long non-commercial positions are the total long position of non-commercial traders.
- Non-commercial short positions are the total short position of non-commercial traders.
- Total non-commercial net position is the difference between the short and long positions of non-commercial traders.