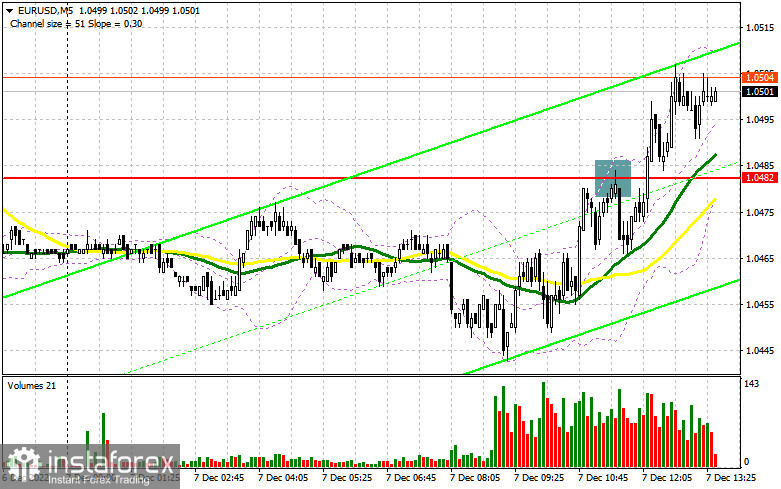
In the morning, we focused on the mark of 1.0514 and considered entering the market from there. Let's take a look at the M5 chart to get a picture of what happened. Growth and a false breakout through 1.0482 produced a sell signal but instead of a fall, the pair rebounded, supported by the publication of rosy data in the eurozone. The price retested the mark of 1.0482 and broke through it, which triggered a bullish correction. Therefore, the trading plan for the second half of the day has been changed.
When to go long on EUR/USD:
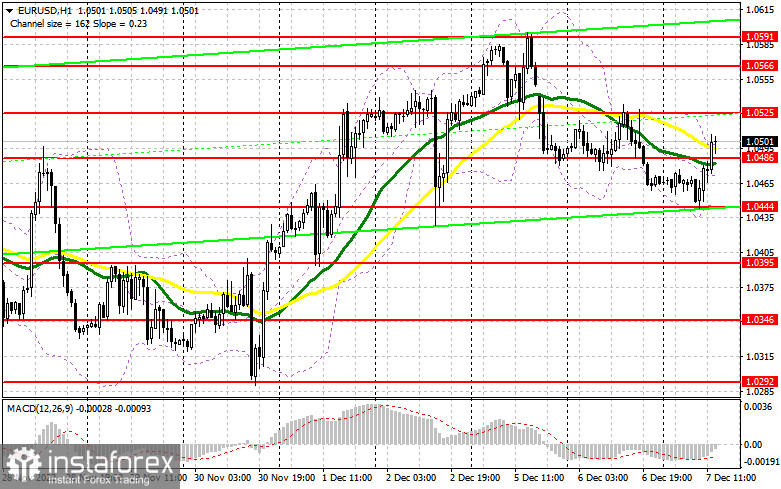
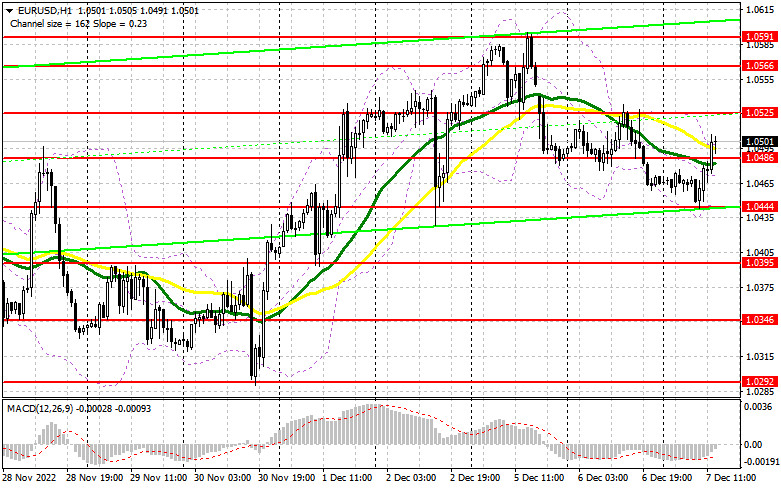
The GDP report in the eurozone was not only upwardly revised but also came better than expected. That allowed the buyers to regain control over the resistance level of 1.0482, and the bearish movement stopped. Meanwhile, the US statistics are unlikely to somehow affect the market today. Therefore, it remains to be seen whether the buyers manage to stay in control. Moreover, the reports delivered today in the US have little to do with the forex market. Thus, to extend the uptrend, the bulls should protect the support level of 1.0486. It will become possible to go long after a false breakout through it, as this will create a buy entry point. The quote may then retest yesterday's high of 1.0525. After a breakout and a retest of this mark to the downside, and the buyers may push the price to 1.0566. The pair may then rise to the monthly high of 1.0591 where taking profit could be considered. If EUR/USD rises during the North American session when there is no bearish activity at 1.0486, the pressure on the pair will increase, triggering a row of the bull's stop orders. In such a case, a false breakout through the support level of 1.0444, today's low, will give a buy signal. It will also be possible to open long positions on EUR/USD right after a bounce off 1.0395, or even lower, at 1.0346, allowing a bullish correction of 30-35 pips intraday.
When to go short on EUR/USD:
The sellers updated yesterday's low, retested the mark of 1.0482, and lost control over the market. They now should restore their positions at the level of 1.0486 that served as resistance in the morning. In addition, they should protect the resistance level of 1.0525. This is where it would be wiser to go short in the second half of the day. A false breakout through the barrier may coincide with the release of macro data in the US. A sell signal will be made, and the pair will fall to the nearest support level of 1.0486. A breakout and consolidation below it, with a retest of the range to the upside, will generate an additional signal and trigger a row of bullish stop orders. The pair will plunge to 1.0444 where it would be wiser to engage in profit-taking. If EUR/USD rises during the North American session when there is no bearish activity at 1.0525, the sellers may start leaving the market again. In such a case, bullish activity will increase and the uptrend will resume with the price ascending to 1.0566. Therefore, a smart thing to do would be to go short there after a false breakout only. It will also become possible to sell EUR/USD immediately after a bounce off the 1.0591 high, allowing a bearish correction of 30-35 pips.
Commitments of Traders:
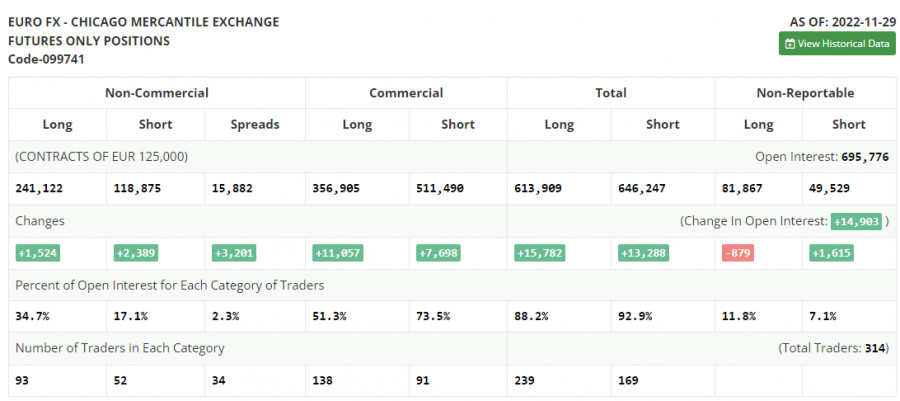
The COT report for November 29 logged an increase in both long and short positions. Jerome Powell's statement last week helped retain demand for risk assets, including the euro. Given that the pair has been on the rise since November, more and more traders are now willing to sell the instrument at the current price. The latest macro data from the US, namely, business activity and labor market indicators, allows traders to expect a continuation of the tightening cycle in the US next year. In this light, there is no good reason to open long positions in the medium term, as the higher the euro climbs, the deeper it will fall. This trading week is likely to be calm, so traders may shift their attention to the FOMC meeting, due on December 13-14. According to the COT report, long non-commercial positions increased by 1,524 to 241,122, and short non-commercial positions grew by 2,389 to 118,875. The weekly total non-commercial net position decreased slightly to 122,234 from 123,112. This indicates that investors are no longer in such a hurry to buy back the undervalued euro as a few months earlier. The weekly closing price advanced to 1.0342 from 1.0315.
Indicator signals:
Moving averages
Trading is carried out near the 30-day and 50-day moving averages, illustrating uncertainty in the market.
Note: The period and prices of moving averages are viewed by the author on the hourly chart and differ from the general definition of classic daily moving averages on the daily chart.
Bollinger Bands
Support is seen at 1.0444, in line with the lower band.
Indicator description:
- Moving average (MA) determines the current trend by smoothing volatility and noise. Period 50. Colored yellow on the chart.
- Moving average (MA) determines the current trend by smoothing volatility and noise. Period 30. Colored green on the chart.
- Moving Average Convergence/Divergence (MACD). Fast EMA 12. Slow EMA 26. SMA 9.
- Bollinger Bands. Period 20
- Non-commercial traders are speculators such as individual traders, hedge funds, and large institutions who use the futures market for speculative purposes and meet certain requirements.
- Long non-commercial positions are the total long position of non-commercial traders.
- Non-commercial short positions are the total short position of non-commercial traders.