M5 chart of GBP/USD
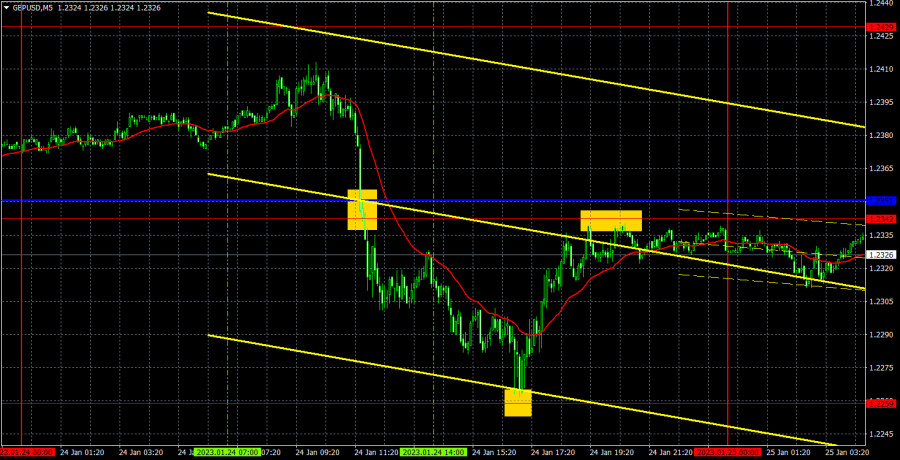
The pound plummeted after the poor UK PMI data. In our article on the euro, we said that traders did not react to similar reports from the EU and the US, but in the pound's case, the time when sterling started to fall had perfectly coincided with the release of the PMI data. The very essence was not exactly clear. The PMI for the manufacturing sector was slightly higher, while the PMI for the services sector was slightly down. How can such data be interpreted in favor of the dollar? But take note that traders had formal reasons to sell the pair, and recently, we haven't seen the market react in a logical manner. Therefore, it was necessary to rejoice yesterday, instead of asking questions. Now the pound is below the critical line, which allows us to expect a decline by 400-500 points within the new round of the global correction. Keep in mind that the meetings of the Bank of England and Federal Reserve will take place next week, and the market can slowly change its attitude towards the dollar and the pound, as it has enough time to work out the most probable decisions at the future meetings.
Speaking of trading signals, as well as twenty-four hours earlier, everything was fine. The pound was moving in a trend, so the trading signals were quite good. First, the pair crossed the 1.2342-1.2351 area, and then fell to 1.2259, having worked with minimum error. The rebound from 1.2259 announced the need to close the short positions and open the longs. The profit was about 50 pips. The buy signal should have worked too, and it gained another 50 pips, as the price managed to go back to 1.2342. As a result, traders gained about 100 pips.
COT report
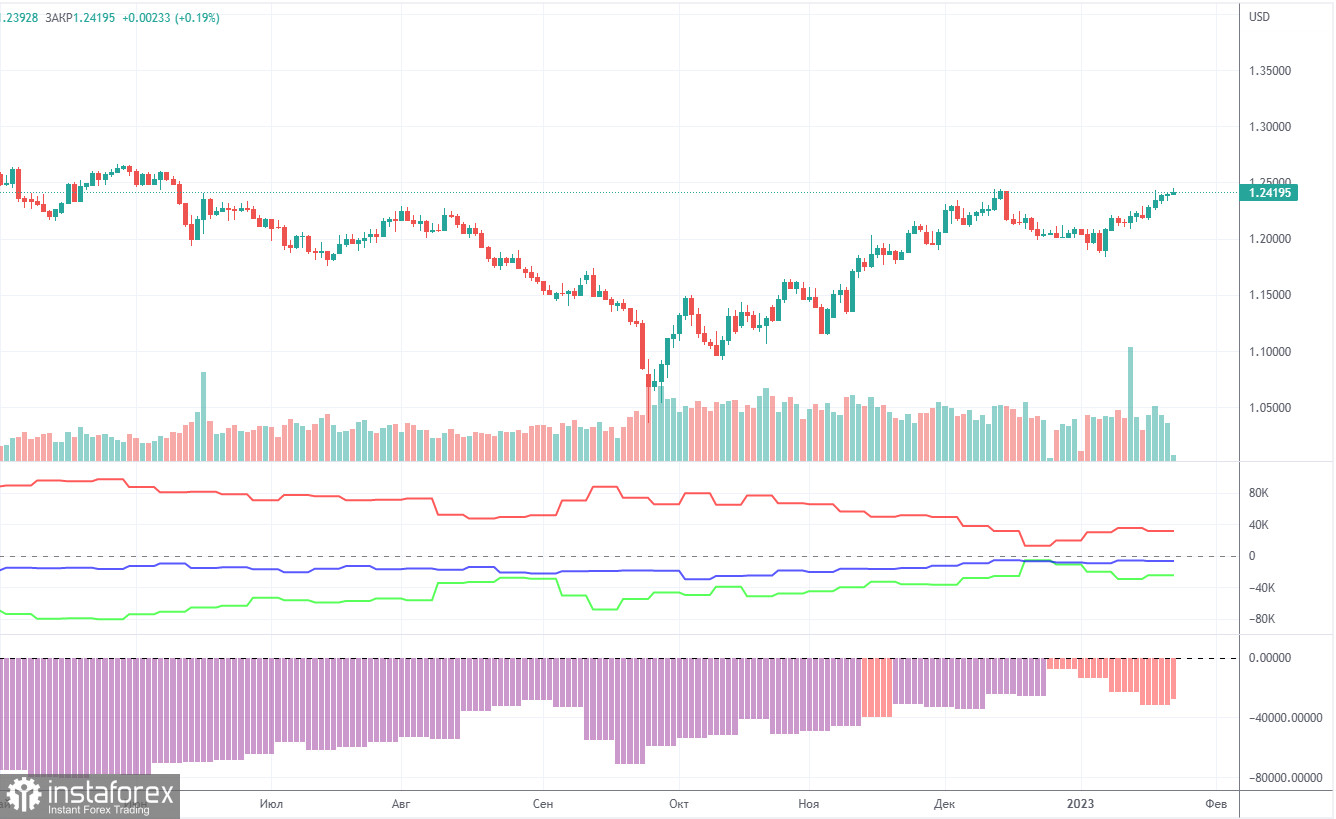
The latest COT report showed a decrease in bearish sentiment. During the given period, non-commercial traders opened 5,500 long positions and as many as 700 short positions. Thus, the net position increased by 4,800. This figure has been on the rise for several months, and the sentiment may become bullish in the near future, but it hasn't yet. Although the pound has grown against the dollar for the last few months, from a fundamental perspective, it is difficult to answer why it keeps rising. On the other hand, it could fall in the near future (in the mid-term prospect) because it still needs a correction. In general, in recent months the COT reports correspond to the pound's movements so there shouldn't be any questions. Since the net position is not even bullish yet, traders may continue to buy the pair over the next few months. Non-commercial traders now hold 41,500 long positions and 66,000 short ones. I remain skeptical about the pound's long term growth, though there are technical reasons for it. At the same time, fundamental and geopolitical factors signal that the currency is unlikely to strengthen significantly.
H1 chart of GBP/USD
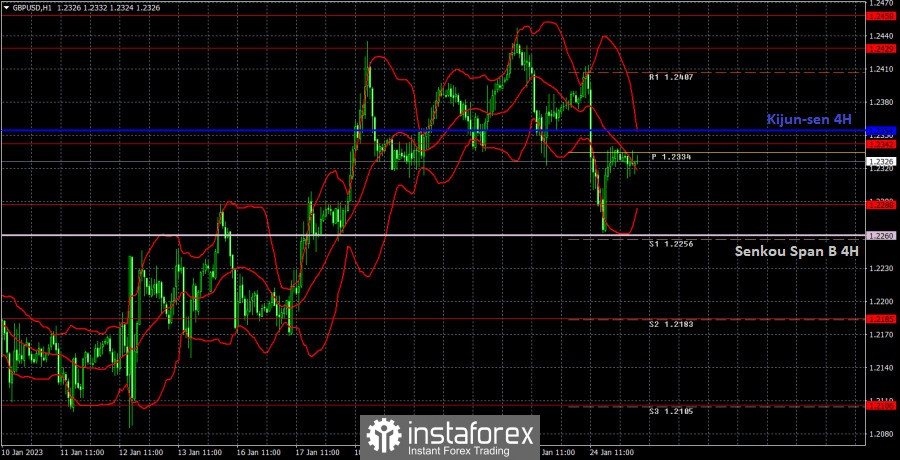
On the one-hour chart, GBP/USD risks breaking the uptrend. While the price is above the Senkou Span B line, the upward movement can resume almost at any moment. But overcoming the critical line is already a heavy step to a new round of downward movement. On January 25, the pair may trade at the following levels: 1.2106, 1.2185, 1.2288, 1.2342, 1.2429-1.2458, 1.2589, 1.2659. The Senkou Span B (1.2260) and Kijun Sen (1.2351) lines may also generate signals. Pullbacks and breakouts through these lines may produce signals as well. A Stop Loss order should be set at the breakeven point after the price passes 20 pips in the right direction. Ichimoku indicator lines may move during the day, which should be taken into account when determining trading signals. In addition, the chart does illustrate support and resistance levels, which could be used to lock in profits. On Wednesday, there are no important events in the US and the UK, so the pair can calm down and take a small break. Nevertheless, if sterling continues to fall, we will consider it as a logical step from a technical perspective.
What we see on the trading charts:
Price levels of support and resistance are thick red lines, near which the movement may end. They do not provide trading signals.
The Kijun-sen and Senkou Span B lines are the lines of the Ichimoku indicator, moved to the one-hour chart from the 4-hour one. They are strong lines.
Extreme levels are thin red lines from which the price bounced earlier. They provide trading signals.
Yellow lines are trend lines, trend channels, and any other technical patterns.
Indicator 1 on the COT charts reflects the net position size of each category of traders.